Here is something that happened in our shop last week. We had a developer sound a fire alarm because he found that his server was paging. He was kind enough to send along a screenshot from task manager:
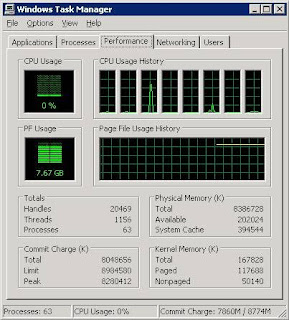
This server is running 2003 R2, x64 Enterprise, SP2, with 4 CPU (hyper-threaded). The task manager has the terms “PF Usage” and “Page File Usage History”, and previously those locations were used to reference memory. I believe that they do, indeed, represent memory, and are simply mislabeled at this point.
A quick check of perfmon shows that the % Usage for the Paging File is at 20%, but Task Manager is displaying a much higher percentage. We also asked the developer if they were having any performance issues, perhaps with a particular query, but they did not provide an example. They simply assumed the server was paging and wanted to alert everyone to stop what they were working on and quickly “fix” this box. Oh, and better check on production as well, to make certain that server is not “paging”.
Not sure if anyone else has run into a similar situation yet or not.
UPDATE:
This just in:
http://answers.yahoo.com/question/index?qid=20080220084730AAlbgFO
“The graphs and meters. Despite their headings, the PF Usage and Page File Usage History displays don’t measure Page File Usage. They measure the total commit charge. The total commit count is sort of related to page file use; it’s how much page file you’d use if everything that could possibly get written to the pages file, was in fact written to the page file. On Windows 2000, the same displays are called Mem Usage, leading people to think they measured physical memory use. That wasn’t right either.”
and this:
So, i am just behind the times on this one.
Oh well, at least I am not Crazy.