SQL Plan Warnings
March 24, 2020
There are many methods available for optimizing the performance of SQL Server. One method in particular is examining your plan cache, looking for query plan warnings. Plan warnings include implicit conversions, key or RID lookups, and missing indexes to name a few. Each of these warnings is the optimizer giving you the opportunity to take action and improve performance. Unfortunately, these plan warnings are buried inside the plan cache, and not many people want to spend time mining their plan cache. That sounds like work.
That's why last year our company (SolarWinds) launched a free tool called SQL Plan Warnings. Often mining the plan cache involves custom scripts and forcing you to work with text output only. We wanted to make things easier by providing a graphical interface. A GUI will allow for the user to have basic application functionality. Things like connecting to more than one instance at a time, or filtering results with a few clicks.
Let me give a quick tour of SQL Plan Warnings.
Connect to an instance
The first thing noteworthy here is how SQL Plan Warnings supports connecting to a variety of flavors of SQL Server. There's the Earthed version, Azure QL Database, Azure SQL Database Manage Instance, and Amazon RDS for SQL Server as shown here:

From there you fill in your connection details. The login you choose will need either the VIEW SERVER STATE or SELECT permission for the following DMVs: dm_exec_query_stats, dm_exec_sql_text, and dm_exec_text_query_plan. I've provided links to the Microsoft docs for each, so you can review the permissions defined there.
Being able to easily connect to instance of SQL Server, no matter where they are located, is a must-have these days.
SQL Plan Warnings Settings
After you connect to your instance, SQL Plan Warnings will return the top 100 plans, with a default sort by CPU time. However, it is possible after connecting you may see no results. This is likely due to the default settings for SQL Plan Warnings. You get to the settings by clicking on the gear icon in the upper-right corner. Here is what the default settings look like:

If you are not seeing any results, change the default settings and refresh plan analysis. For me, I simply made the change to filter by executions, with 1 as the minimum. This returns a lot of noise, so you need to discover what makes the most sense for your particular instance.
Please note these default settings apply to each connected instance. Think of these settings as the highest level filter for all your connected sources. It may be possible you spend time adjusting these settings frequently, depending on the instance, the workload, and your query tuning goals.
Reviewing the SQL Plan Warnings Results
After plan analysis is complete, you will see a list of warnings found. It should look like this:
Note that a plan can have multiple warnings. So this list could be generated by one or more plans found.
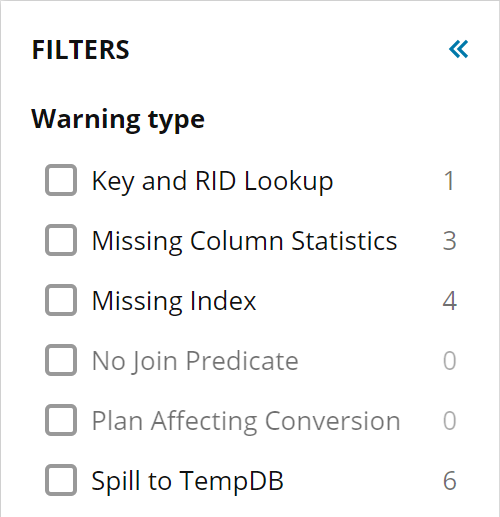
From here we are able to filter on a specific warning type with a simple click. This allows us to narrow our focus. Perhaps today we want to focus on Key and RID lookups. We select that filter, then open the plan:

From here we can zoom and scroll, and view the node that has the lookup warning:

If we select the node a properties dialogue that opens to the right. We also see other warnings are included in this plan, if we want or need to investigate those at this time. We also have the ability to download the plan, if desired.
Summary
The SQL Plan Warnings tool is easy to use and allows for you to be proactive in optimizing your environment. The use of a GUI allows for quick filtering at the plan cache level as well as plan warnings themselves. This allows you to focus on the plan warnings with the most impact.
One thing to note is the size of the plan cache you choose to analyze. Instances with larger plan cache sizes (1GB or greater) may require a larger number of plans to parse for warnings.
You can download the SQL Plan Warnings tool here.