Last week I posted a puzzle of sorts. I showed you a handful of graphs from PAL and asked if anyone could determine what had happened. Out of all the comments that were left only a handful of people seemed to be on the right track, or showed a methodology in their thinking that should have gotten them to the same conclusion.
The answer to the scenario last week is this: Someone ran a SELECT statement, and that statement needed to read pages from disk into memory, which flushed all the existing pages out.
There was no issue with hardware, there was no magic knob to turn to make performance better, or to have prevented any end user from running such a statement. The answer wasn’t complex, either. Just one user, running a valid query that needed to pull in a lot of data.
Sometimes, as a DBA, all you can do is educate. You are not always able to press a button to make problems go away completely.
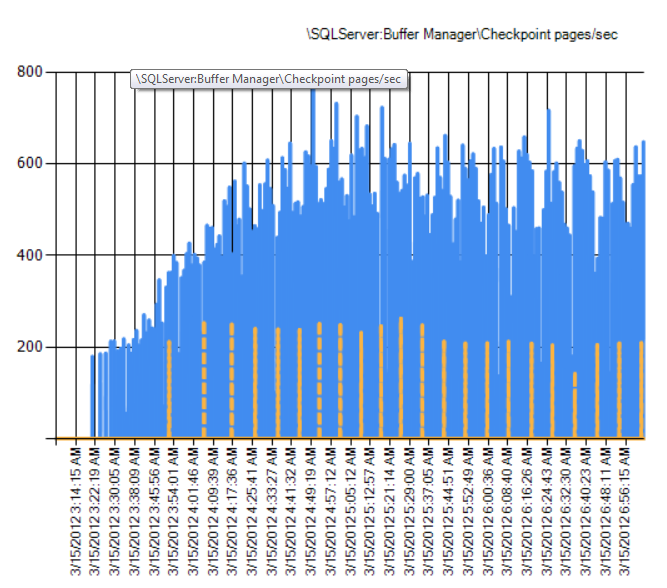
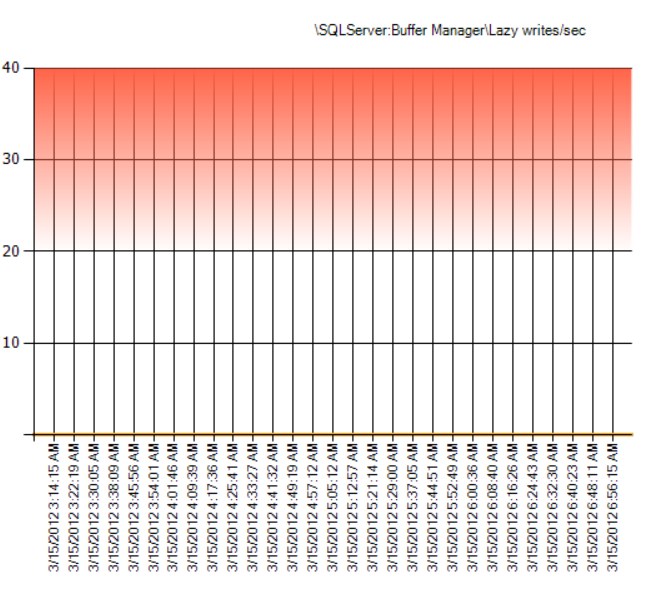
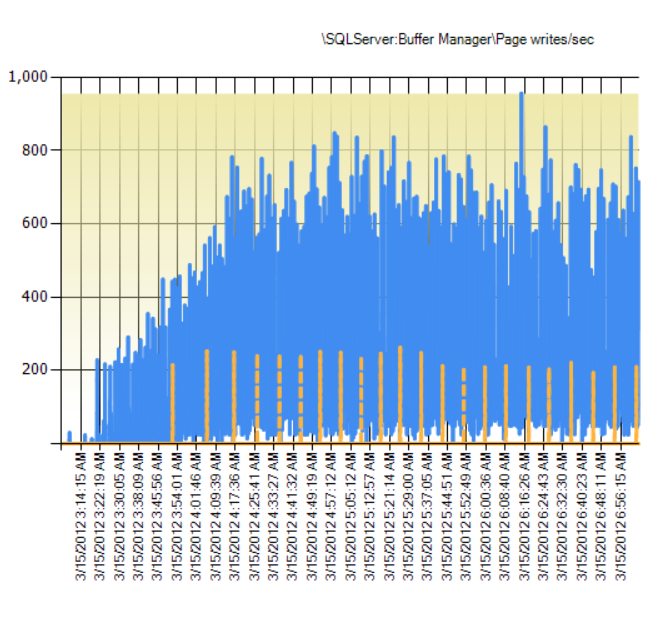
Here is another one for you today. Can anyone explain what is happening here, and what actions a DBA would take when presented with these details…or if any action should be taken?


Leave your thoughts and answers in the comments, I would love to hear what you believe is happening to my server.


Looks like a system with plenty of memory, configured with a low recovery interval….
I agree with Tracy. Looks like a high volume server with some code that issues checkpoints frequently, or as Tracy mentioned, a small recovery interval configuration on the server. What action should a DBA take here? I don’t think any is needed. (Well, maybe increase the frequency of t-log backups if this is in fact caused by data changing frequently in a db in full recovery mode.)
By the way, I love this little series! This is a great idea!
Shaunjstu,
Would a transaction log backup have anything to do with what you see in those charts?
To me it looks like the SQL Server cannot meet the required recovery interval. I would like to check few things
– recovery interval settings
– free space on the disk used for log
– any potential problems with I/O on that disk
– size and fullness of log file, settings of log file
I don’t think a code or small recovery interval is to blame. You cannot really answer performance questions with ‘you are doing too many updates’. Transaction logs do not cause checkpoints so frequency will not change anything. I don’t think there are too many scenarios when one would actually want to change recovery interval from the default 60 seconds, but I would check it just to see what it is.
What I think it is, is the log file may be too small (space on the storage device or size limit). The log file access may be too slow. That is were I would start looking for an answer.