It’s Sunday evening. You are sitting down to have dinner with your family. Suddenly your phone rings. You want to ignore it because, let’s face it, your phone rings a lot. But you see the person calling and knowing they don’t call very often you decide to answer. On the other end of the line a harried voice tells you the words that every DBA dreads hearing:
“The server is slow.”
Many thoughts run through your head: Well of course it is, otherwise you wouldn’t be calling, right? And why doesn’t anyone ever call me to tell me that the server is running fast? And what, exactly, is meant by “slow”?
“OK, do you have any other details for me?” you ask.
“Yeah, I sent you an email an hour ago with some charts that PAL returned. Don’t you check your email all day on Sundays?”
You resist the urge to hang up and go to your laptop to examine the images that were sent. You see the following:
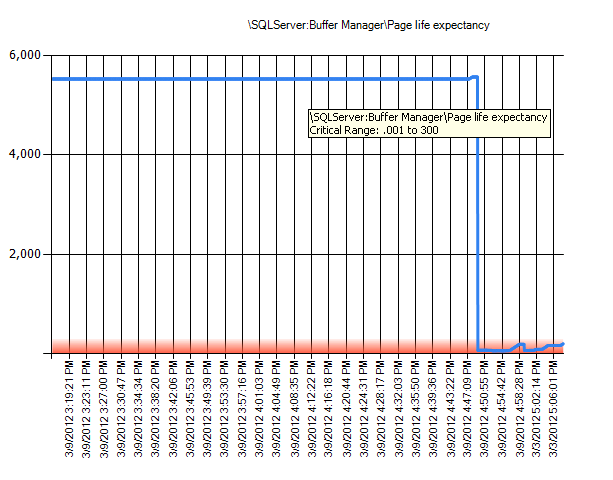
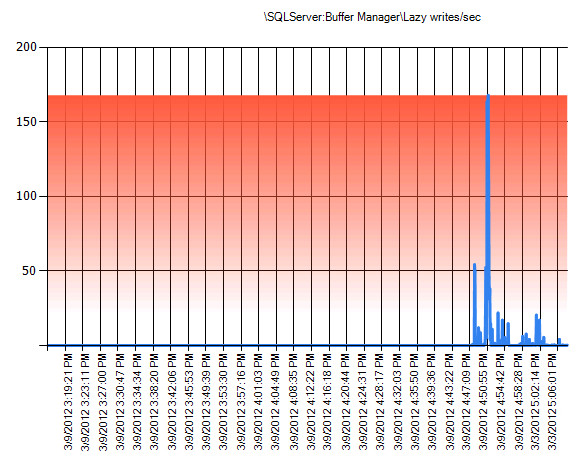
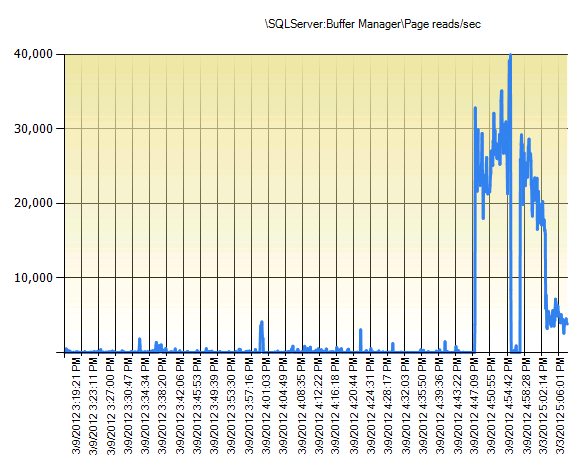
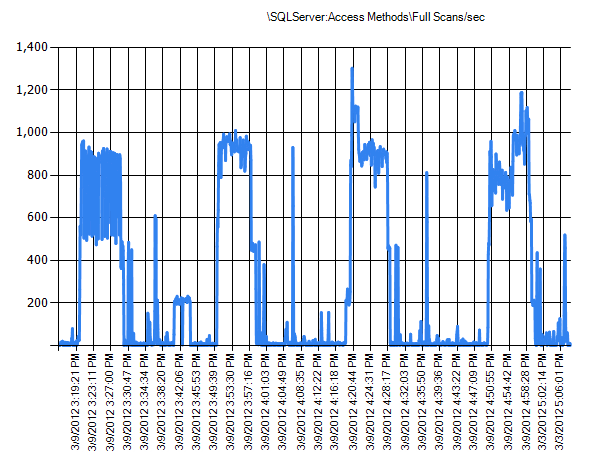
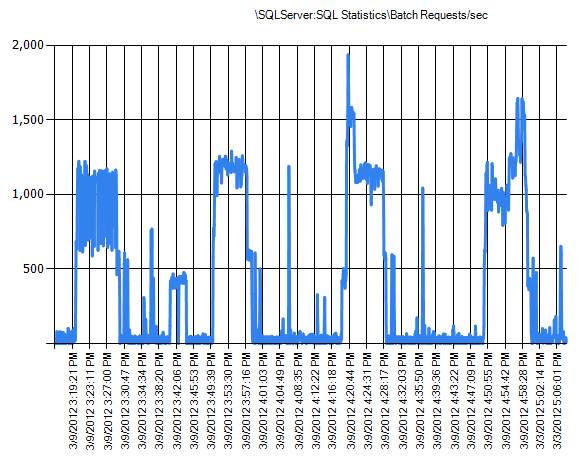
So, why is the server running slow?
Next week Jason Strate (blog | @stratesql) and I will be doing a presentation for the Minnesota SQL Server User Group (PASSMN). The title of the talk is “Choose Your Own Adventure: Performance Tuning”. We will walk you through a scenario not unlike the one I have outlined above. We will talk about the various techniques you have at your disposal when it comes to performance tuning and help you understand which techniques are most useful.
And you, the audience, will decide how we troubleshoot and solve the scenario presented. Life is an adventure, and at times so is performance monitoring and troubleshooting.
Think about what you would do first for the scenario above, or what a new DBA might do, or what an MCM might do. Think about how long you have before your manager decides to hire a DBA that has all the answers already. Think about what you can do to fix this issue immediately. What steps would you take? What questions would you ask? Leave your comments below.


Did someone kick off an index rebuild or a checkDB around 4:45?
Something’s just displaced the entire buffer pool, but neither batches/sec nor full scans/sec show a sharp increase at the same time (just what look like regular patterns)
Also did the SQL memory usage just get a severe trim (check the PAL logs for total server memory)? If so, see if there’s anything odd running on the server, or maybe a large file copy in progress.
No, there was no index rebuild or checkdb kicked off, and that was my first thought as well. But those aren’t done at that time of day on a Sunday, so I ruled it out just as quickly.
(also, i don’t believe checkdb goes through the buffer pool anyway, so that shouldn’t have flushed everything).
The batches/sec and full scans/sec are just the numbers of batches and scans, and has nothing to do with the AMOUNT of data being scanned.
Nothing odd running on the server, no file copies, no memory trimming.
CheckDB does go through the buffer pool, it uses the normal page reading methods to load data. It’s backups that don’t go through the buffer pool.
OK, but CHECKDB was not the issue here.
DBCC DROPCLEANBUFFERS ?
as in.. did someone run it before interrupting the DBAs sunday..
no, DROPCLEANBUFFERS was not issued.
sys.dm_exec_query_stats. Anything with a last execution time > 4:47 that’s doing an unusually high number of physical reads. By unusually high, I mean around enough to displace a large proportion of the buffer pool?
or anyone running an Update Statistics on all tables around that time?
Also maybe check the default trace (the Audit DBCC Event) for any DropCleanBuffers and/or the error log for any buffer pool flushes
What is running every 30 minutes? Some scheduled job?
So it looks like one or a few queries that are reading much more than they should – this could be caused by bad /outdated statistics, a bug in a query that isn’t called very often (e.g an inadvertent cartesian join).
Run sp_who2. Look for queries running for a suspiciously long time, run dbcc inputbuffer(spidID) to find out the queries. Debug.
Also, depending on how well you know the db and you’re sure the consequences are acceptable for killing a spid, you can use the kill command to take out long-running queries.
Amax,
Statistics are not outdated, and there is no bug in the query.
However, you are the closest in guessing that one (or a few) queries are reading a lot of data.
If it’s one or a couple of queries, it’s tough to diagnose exactly what is causing the problem just from the graphs presented, because there are many things that it could be, at least given my level of understanding. The lazy writes are spiking because the db needs to clean the dirty pages that other operations are running so as to free up more memory for the read, I’m assuming. I’m curious if there’s a further way to diagnose the problem just from what you present. I personally would run a sp_who2 followed by a dbcc inputbuffer at this point. I want to say that this might be a blocking/locking problem, but really there are lots of issues it could be given this level of info
So, if my job depended on getting this fixed immediately, I’d find and identify query belonging to the spid that’s long running using sp_who2 /dbccinputbuffer(spid). Kill the spid (this will make the database ‘fast’ again, unless the behavior recurs) Find the query causing the problem and run it using show estimated plan. look for weirdness in the plan. Look at indexing issues first (sometimes a query works efficiently at a low level of data in a table but fails when the table gets above a certain size, because the queryplan is outdated, because the stats are outdated). See if I can replicate the behavior by running the query that I’ve identified as slow, being ready to stop or kill the query if it shows signs of taking over the server again.
Amax,
Yes, you are on the right track, no question. The graphs don’t give all the details, because we still need to know (1) who and (2) what was running. And that’s where the DMVs or sp_who2 would be helpful.
I would start investigating if it system(user iniciated) or user query. If it is system check for backups running, a Partition rebuild/splitting or even someone decided to change the storage method and switch compression on/off.
This to me a process reading alot of data and if statistics are not the problem nor indexes or no bad plan then my best guess would be a extract from the DB to a file where way to many “key lookups” are done (key lookups are BAD but does that qualify as a bad plan?
I’d start by looking at wait stats to see if there is anything obvious there. This looks similar to issues we see often where poor execution plans have suddenly been generated resulting in large table scans.
Has there been a large data load process that has impacted the statistics?
Smellypom,
There was no large data load, and statistics are not an issue. The wait stats tell you that the disk activity is high (PAGEIOLATCH).
Don’t suppose we have sp_whoisactive installed do we?
I’m still thinking bad plan causing high reads, possibly parameter sniffing?
Is there a single query causing the issue or a high number of waiting tasks.
I’m out of ideas but interested in the outcome.
Smellypom,
You are close, but does it have to be a bad plan?
What about the Auto Update of Statistics?
Dji,
What about them? They are enabled, and stats are not the issue.
Somebody is running a report that reads the whole database and produces a single page with the number “42”. 🙂
Has one of the RAID drives failed?
CJ,
No failures (other than human ones).
What kind of disk volume are we on? Is this virtualized or standard install?
Gary,
Physical server, and this isn’t a disk issue.
Someone is rebuilding indexes?
Darn that “Load more comments” button! Didn’t see this was already suggested.
Page life expectancy really dipped low. Did someone fire a lot of poor adhocs leading to useful data being pushed out of cache.?
Is there a full text catalog in the database ?
An “event” took place at ~4:49pm that wiped out the PLE. Full scans and batches/sec don’t seem to have changed. I would check the following:
– recompiles/sec (did somebody flush the cache or restart the instance?)
– is SQL using the max memory allocated to it? (not using locked pages, something external took memory away?)
– is there a full backup underway?
Please Mr SQLRockstar could you give us the answer… and end my suffering..
Djl,
I posted the answer…and another scenario…here: http://thomaslarock.com/2012/03/what-happened-here/
Ha! I knew the right answer was a bad query!
Maybe the report showed something more than just “42”, but it definitely read a lot of data.
Sometimes the simplest answer is the right one!
Thanks for sharing.