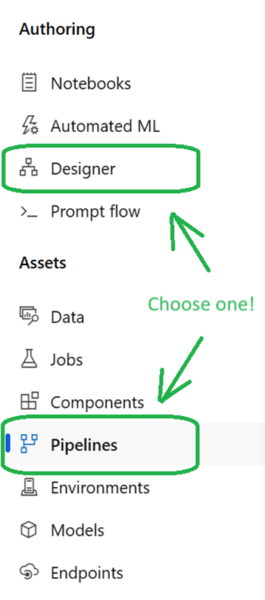
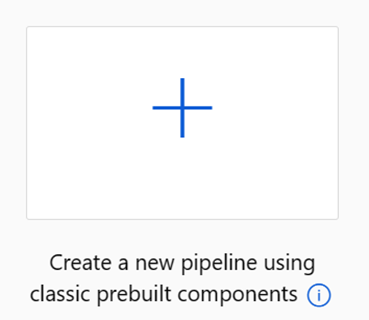
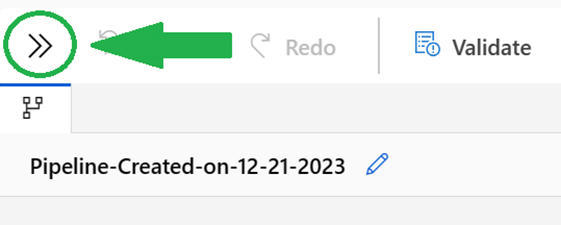
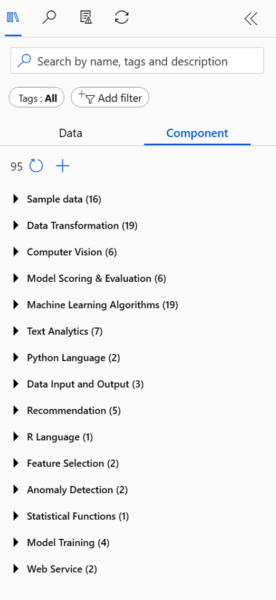
<?xml version="1.0" encoding="utf-8"?><feed xmlns="http://www.w3.org/2005/Atom" ><generator uri="https://jekyllrb.com/" version="3.10.0">Jekyll</generator><link href="https://sqlrockstar.github.io/feed.xml" rel="self" type="application/atom+xml" /><link href="https://sqlrockstar.github.io/" rel="alternate" type="text/html" /><updated>2026-05-11T15:58:08-04:00</updated><id>https://sqlrockstar.github.io/feed.xml</id><title type="html">Thomas LaRock</title><subtitle>Data engineering, developer advocacy, and technical leadership insights
</subtitle><entry><title type="html">The Long Way ‘Round</title><link href="https://sqlrockstar.github.io/2026/05/the-long-way-round/" rel="alternate" type="text/html" title="The Long Way ‘Round" /><published>2026-05-11T00:00:00-04:00</published><updated>2026-05-11T00:00:00-04:00</updated><id>https://sqlrockstar.github.io/2026/05/the-long-way-round</id><content type="html" xml:base="https://sqlrockstar.github.io/2026/05/the-long-way-round/"><![CDATA[<link rel="icon" type="image/x-icon" href="/gravatar.png" />

<h2>Showing Up</h2>

<p>This past weekend I graduated from Georgia Tech with a Master’s in Analytics.</p>

<p>That’s not a sentence I would have expected to write thirty years ago.</p>

<p>Back then, I found myself on the Georgia Tech campus, sitting across from a professor who, in a polite and professional way, told me I was not good enough to attend. The rejection was deflating but not devastating. I knew my undergraduate record was not the strongest, and I was looking for a chance wherever I could find one.</p>

<p>So, I did what had worked for me up to that point in my life.</p>

<p>I showed up.</p>

<p>I traveled to campus with my girlfriend, believing if I made the effort, had the conversation, and made my case, I might be able to change the outcome. Up until then, that approach had served me well. It’s amazing how many opportunities one can get simply by showing up. Doors tend to open if you are willing to walk up and knock.</p>

<p>Until they don’t.</p>

<p>Looking back, I can see I misunderstood the moment. This was Georgia Tech, one of the best technical schools in the country, and I was a burned-out math major trying to talk his way into graduate school after taking time off. Still, I believed if someone gave me the opportunity, I could figure it out eventually.</p>

<p>The campus bookstore even had t-shirts that joked about MIT being “the Georgia Tech of the North.” I remember seeing that and thinking… maybe I had misread the room...just a little.</p>

<p>Still, I was determined to go somewhere.</p>

<h2>The Plan (That Wasn’t)</h2>

<p>The original plan had been to take a year off after finishing my undergraduate degree. I was burned out and wanted time to reset. A mentor advised against the gap year. Since I was in my early 20’s, I was confident I knew more than anyone else, so I took the year off anyway.</p>

<p>One year turned into three. Life is what happens when you are busy making other plans.</p>

<p>Getting back into academia proved harder than expected. Funded positions were competitive, and I was working to improve my GRE scores while applying anywhere that might give me a shot. Eventually, I found the right fit at Washington State University, where I earned my Master’s in Mathematics and was given the opportunity to grow into the work. Along the way, my girlfriend became my fiancée, and I found myself facing a new question: <a href="https://www.youtube.com/watch?v=UaO8RHLCwQ0&amp;t=100s">"What do now?"</a></p>

<p>At one point, I thought the answer might be college basketball.</p>

<p>I was playing and coaching regularly, and I knew enough coaches to believe I might get a chance if I stuck with it. The plan was simple: keep working camps, meet the right people, and eventually land a role. I did not say it was a great plan, but it had the key ingredient most plans have at that age: overconfidence.</p>

<p>Over time, reality set in. The lifestyle of constant travel, frequent moves, and time away from family lost its appeal. I also developed an appreciation for things like food and shelter, and coaching did not always guarantee either.</p>

<p>So, I pivoted.</p>

<h2>A Different Door Opens</h2>

<p>As I was making my exit from academia, I interviewed with a consulting firm. The hiring manager had a PhD in Physics, and we spent most of our conversation talking about math, science, and the courses I had taken.</p>

<p>I had no real programming experience, which made me a questionable fit on paper.</p>

<p>At the end of the interview, he said something I have never forgotten: “You have never been a programmer, have no corporate experience, but you have a master’s in math. I can teach you how to program, you will learn the rest.”</p>

<p>And he did.</p>

<p>That single opportunity set the direction for the next 28 years of my career. Like many people, I found something that worked and stayed with it. Aside from a layoff during the dot-com era early on, my professional life settled into a long stretch of stability: only two jobs over more than twenty years.</p>

<p>It was consistent, predictable, and, for the most part, satisfying.</p>

<h2>The Gap</h2>

<p>Over time, the field changed.</p>

<p>Analytics evolved. Tools became more powerful. Expectations shifted. I could tell where I was relying on experience instead of understanding. I knew how to use the tools and get results, but there is a difference between knowing and understanding. The difference between looking up in the sky, seeing the stars, but not seeing the light.</p>

<p>Eventually, that difference started to matter.</p>

<p>I suspect this happens to most people eventually, if they are paying attention. You reach a point where experience alone no longer feels like enough. If you have been in your career long enough, you probably recognize the feeling. Things are working, but you notice the gaps. You can keep going as you are, or you can decide to go back and fill them in.</p>

<p>I think, deep down, I knew I was not ready to become someone whose best learning experiences were all behind him.</p>

<h2>Back to School</h2>

<p>That’s when I found the <a href="https://pe.gatech.edu/degrees/analytics">Online Master of Science in Analytics (OMSA) program at Georgia Tech</a>.</p>

<p>Same school, different doorway. I would be lying if I said I was not afraid of facing a second rejection. Here I was, again asking for someone to give me a chance, and needing to show them I was capable of doing the work.</p>

<p>I gathered recommendations, submitted everything, and waited. I even thought briefly about visiting campus again but decided against it. Old habits die hard, I guess. This was not about making an impression. It was about being prepared.</p>

<p>When the acceptance came, I did not overthink it.</p>

<p>I got to work.</p>

<h2>When Everything Moves</h2>

<p>I started the program in January 2023. I jumped in with two classes right away, thinking I needed to “catch up,” even though I was never “behind” to begin with. Around the same time, everything else in my life started to shift.</p>

<p>After more than two decades of stability, my professional world became far less predictable.</p>

<p>Jobs and roles shifted. Companies changed direction. Stability gave way to uncertainty.</p>

<p>Some of the changes were my choice. Most were not. Taken together, these changes created a level of disruption I had not experienced in years. The consistency I had taken for granted was gone, replaced with sustained uncertainty.</p>

<p>Through all of it, my wife had a front-row seat to the chaos, which I am fairly certain was not part of the original sales pitch back in 1994.</p>

<p>Before my entry to the OMSA program, I found Stoicism. A core tenet of Stoicism is the ability to recognize the boundary between what you can, and cannot, control. It’s a simple concept, but a difficult one to apply in a consistent manner. Jobs change. Organizations evolve. Plans don’t always hold.</p>

<p>The work, however, is always there.</p>

<p>And showing up, it turns out, is still important. But life tends to demand more than just your presence.</p>

<p>So that’s what I did. I focused on my coursework. The assignments and materials gave me the opportunity to not think about all the external instability happening. And I kept going, week after week, semester after semester. Not because I had something to prove, but because the work, and my effort, was something I could control.</p>

<h2>The Return</h2>

<p>As I sat at commencement, I thought back to that first visit to Georgia Tech — the cramped office, the short conversation, and the realization I was not ready. At the time, I believed showing up was enough. And for a while, it was.</p>

<p>Until it wasn’t.</p>

<p>For a long time, when I thought about writing this story, it centered around the initial rejection from Georgia Tech all those years ago. When I started putting words on paper I jokingly referred to earning this degree as my “revenge tour.”</p>

<p>Sitting at commencement, though, I realized it was never about the rejection, or revenge. What I craved, all these years later, was **resolution**.</p>

<p>Looking back, I do not think the professor was wrong that day so many years ago. What I did not understand then was how much timing matters in life. If I had attended and struggled, that would not have been success for anyone. It would have been a different, and much harsher, lesson.</p>

<p>Instead, I went somewhere else. I learned what I needed to learn, built a career, raised a family, and eventually found my way back.</p>

<p>*Amor fati.*</p>

<p>The rejection was never something to overcome. It was part of the path. The rejection did not define me, it pushed me to keep going, keep learning, and to be ready when the opportunity to “show up” came again, but through a different door.</p>

<p>Because sometimes showing up is enough.</p>

<p>And sometimes it is not.</p>

<p>The difference is knowing which moment you are in, and what to do next.</p>

<p><img src="https://sqlrockstar.github.io/wp-content/uploads/2026/05/GT_grad_pose_tech_tower.jpeg" alt="Grad pose with Tech Tower" style="width:75%; display:block; margin: 0 auto;" /></p>]]></content><author><name></name></author><category term="personal" /><category term="education" /><category term="analytics" /><category term="georgia-tech" /><category term="analytics" /><category term="omsa" /><category term="career" /><category term="stoicism" /><summary type="html"><![CDATA[Showing Up This past weekend I graduated from Georgia Tech with a Master’s in Analytics. That’s not a sentence I would have expected to write thirty years ago. Back then, I found myself on the Georgia Tech campus, sitting across from a professor who, in a polite and professional way, told me I was not good enough to attend. The rejection was deflating but not devastating. I knew my undergraduate record was not the strongest, and I was looking for a chance wherever I could find one. So, I did what had worked for me up to that point in my life. I showed up. I traveled to campus with my girlfriend, believing if I made the effort, had the conversation, and made my case, I might be able to change the outcome. Up until then, that approach had served me well. It’s amazing how many opportunities one can get simply by showing up. Doors tend to open if you are willing to walk up and knock. Until they don’t. Looking back, I can see I misunderstood the moment. This was Georgia Tech, one of the best technical schools in the country, and I was a burned-out math major trying to talk his way into graduate school after taking time off. Still, I believed if someone gave me the opportunity, I could figure it out eventually. The campus bookstore even had t-shirts that joked about MIT being “the Georgia Tech of the North.” I remember seeing that and thinking… maybe I had misread the room...just a little. Still, I was determined to go somewhere. The Plan (That Wasn’t) The original plan had been to take a year off after finishing my undergraduate degree. I was burned out and wanted time to reset. A mentor advised against the gap year. Since I was in my early 20’s, I was confident I knew more than anyone else, so I took the year off anyway. One year turned into three. Life is what happens when you are busy making other plans. Getting back into academia proved harder than expected. Funded positions were competitive, and I was working to improve my GRE scores while applying anywhere that might give me a shot. Eventually, I found the right fit at Washington State University, where I earned my Master’s in Mathematics and was given the opportunity to grow into the work. Along the way, my girlfriend became my fiancée, and I found myself facing a new question: "What do now?" At one point, I thought the answer might be college basketball. I was playing and coaching regularly, and I knew enough coaches to believe I might get a chance if I stuck with it. The plan was simple: keep working camps, meet the right people, and eventually land a role. I did not say it was a great plan, but it had the key ingredient most plans have at that age: overconfidence. Over time, reality set in. The lifestyle of constant travel, frequent moves, and time away from family lost its appeal. I also developed an appreciation for things like food and shelter, and coaching did not always guarantee either. So, I pivoted. A Different Door Opens As I was making my exit from academia, I interviewed with a consulting firm. The hiring manager had a PhD in Physics, and we spent most of our conversation talking about math, science, and the courses I had taken. I had no real programming experience, which made me a questionable fit on paper. At the end of the interview, he said something I have never forgotten: “You have never been a programmer, have no corporate experience, but you have a master’s in math. I can teach you how to program, you will learn the rest.” And he did. That single opportunity set the direction for the next 28 years of my career. Like many people, I found something that worked and stayed with it. Aside from a layoff during the dot-com era early on, my professional life settled into a long stretch of stability: only two jobs over more than twenty years. It was consistent, predictable, and, for the most part, satisfying. The Gap Over time, the field changed. Analytics evolved. Tools became more powerful. Expectations shifted. I could tell where I was relying on experience instead of understanding. I knew how to use the tools and get results, but there is a difference between knowing and understanding. The difference between looking up in the sky, seeing the stars, but not seeing the light. Eventually, that difference started to matter. I suspect this happens to most people eventually, if they are paying attention. You reach a point where experience alone no longer feels like enough. If you have been in your career long enough, you probably recognize the feeling. Things are working, but you notice the gaps. You can keep going as you are, or you can decide to go back and fill them in. I think, deep down, I knew I was not ready to become someone whose best learning experiences were all behind him. Back to School That’s when I found the Online Master of Science in Analytics (OMSA) program at Georgia Tech. Same school, different doorway. I would be lying if I said I was not afraid of facing a second rejection. Here I was, again asking for someone to give me a chance, and needing to show them I was capable of doing the work. I gathered recommendations, submitted everything, and waited. I even thought briefly about visiting campus again but decided against it. Old habits die hard, I guess. This was not about making an impression. It was about being prepared. When the acceptance came, I did not overthink it. I got to work. When Everything Moves I started the program in January 2023. I jumped in with two classes right away, thinking I needed to “catch up,” even though I was never “behind” to begin with. Around the same time, everything else in my life started to shift. After more than two decades of stability, my professional world became far less predictable. Jobs and roles shifted. Companies changed direction. Stability gave way to uncertainty. Some of the changes were my choice. Most were not. Taken together, these changes created a level of disruption I had not experienced in years. The consistency I had taken for granted was gone, replaced with sustained uncertainty. Through all of it, my wife had a front-row seat to the chaos, which I am fairly certain was not part of the original sales pitch back in 1994. Before my entry to the OMSA program, I found Stoicism. A core tenet of Stoicism is the ability to recognize the boundary between what you can, and cannot, control. It’s a simple concept, but a difficult one to apply in a consistent manner. Jobs change. Organizations evolve. Plans don’t always hold. The work, however, is always there. And showing up, it turns out, is still important. But life tends to demand more than just your presence. So that’s what I did. I focused on my coursework. The assignments and materials gave me the opportunity to not think about all the external instability happening. And I kept going, week after week, semester after semester. Not because I had something to prove, but because the work, and my effort, was something I could control. The Return As I sat at commencement, I thought back to that first visit to Georgia Tech — the cramped office, the short conversation, and the realization I was not ready. At the time, I believed showing up was enough. And for a while, it was. Until it wasn’t. For a long time, when I thought about writing this story, it centered around the initial rejection from Georgia Tech all those years ago. When I started putting words on paper I jokingly referred to earning this degree as my “revenge tour.” Sitting at commencement, though, I realized it was never about the rejection, or revenge. What I craved, all these years later, was **resolution**. Looking back, I do not think the professor was wrong that day so many years ago. What I did not understand then was how much timing matters in life. If I had attended and struggled, that would not have been success for anyone. It would have been a different, and much harsher, lesson. Instead, I went somewhere else. I learned what I needed to learn, built a career, raised a family, and eventually found my way back. *Amor fati.* The rejection was never something to overcome. It was part of the path. The rejection did not define me, it pushed me to keep going, keep learning, and to be ready when the opportunity to “show up” came again, but through a different door. Because sometimes showing up is enough. And sometimes it is not. The difference is knowing which moment you are in, and what to do next.]]></summary></entry><entry><title type="html">Fail Better, Then Finish 21st</title><link href="https://sqlrockstar.github.io/2026/04/fail-better-then-finish-21st/" rel="alternate" type="text/html" title="Fail Better, Then Finish 21st" /><published>2026-04-09T12:35:38-04:00</published><updated>2026-04-09T12:35:38-04:00</updated><id>https://sqlrockstar.github.io/2026/04/fail-better-then-finish-21st</id><content type="html" xml:base="https://sqlrockstar.github.io/2026/04/fail-better-then-finish-21st/"><![CDATA[<link rel="icon" type="image/x-icon" href="/gravatar.png" />

<p>Every March, data scientists and sports fans collide on Kaggle. This year, I came out ahead of 3,464 of them. 21st place out of 3,485 entries. Top 1%. I'll take it.</p>

<p><img src="https://sqlrockstar.github.io/wp-content/uploads/2026/04/kaggle_silver_cert.png" alt="Kaggle 2026 Silver Certificate" style="width:75%; display:block; margin: 0 auto;" /></p>

<p>This is how I did it.</p>

<h2>Why Am I Even Doing This?</h2>

<p>I have an MS in Mathematics, way before some hipster decided to rename "statistics" as "data science". I spent the better part of a decade as a database administrator before deciding I wanted to do more with data than store it. About ten years ago I started consuming and <a href="https://thomaslarock.com/2017/07/why-im-learning-data-science/">learning all things data science</a>, and lurking around other data folks at places like <a href="https://www.kaggle.com/">Kaggle</a>. As you read this I am finishing my second MS degree, this one in Data Analytics from Georgia Tech, I graduate in a few weeks.</p>

<p>Now, I am not saying I spent $10,000+ and three-plus years of my life just to get better at Kaggle competitions.</p>

<p>But, I am not not saying that either.</p>

<p>The <a href="https://www.kaggle.com/competitions/march-machine-learning-mania-2026">Kaggle March Machine Learning Mania competition</a> is a good proving ground. It is time-boxed, the data is clean, the scoring is well-defined, and the competition is deep. This year there were 3,485 entries; not a trivial field. There are serious data scientists in that pool. People who do this professionally, people with larger compute budgets, people with more elegant solutions than mine. Finishing in the top 1% means something.</p>

<p>Well, it does to me, at least.</p>

<p>It also means I have to write this post, now, because when I finish 2000th next year I will want people to forget I ever mentioned it.</p>

<h2>The Approach</h2>

<p>Let me walk you through how I built this, and more importantly, why I made the decisions I did.</p>

<p>The competition asks you to submit a prediction for every possible matchup between two teams in both the Men's and Women's tournaments. With 64 teams in each field, the submission contains 132,133 entries. Each entry has a team identifier and a probability between 0 and 1, representing the likelihood that the lower-seeded team ID wins the game, should these two teams meet. You do not pick teams to advance, you measure their probability of winning any given game. Honestly, this is more fun than a traditional bracket challenge.</p>

<p>The competition is scored using the Brier score. Unlike accuracy, which only cares about right or wrong, the Brier score rewards how confident and calibrated your predictions are. A lower Brier score is better. A perfect model scores 0. A model predicting 50/50 for every game scores 0.25. My final score was 0.1203942, which was the average of the two results for Men (0.1416504) and Women (0.0991382). This is another way of saying I was right on 46 (out of 63) games for the men, and 55 games for the women.</p>

<p>The easiest approach to the competition is to train a model, output some predictions, and call it a day. Some people do exactly that and get decent results. The problem with this method is simple: a model trained carelessly will learn things which are not true, and you only find out after the games are played.</p>

<p>A few deliberate choices made the difference for me.</p>

<h3>Symmetric Training Data</h3>

<p>Every game appears twice in my training data, once with Team A listed first, once with Team B. Without this, the model can quietly learn that “being listed first” correlates with winning, which is obviously nonsense but surprisingly easy for a model to pick up. This doubled the training data and also eliminated perspective bias. Also, I focused exclusively on differentials rather than raw values. For example, instead of using each team's average points scored, I used the scoring gap between the two teams. This gives the model the right context to find meaningful patterns in a head-to-head matchup.</p>

<h3>Walk-Forward Validation</h3>

<p>Standard cross-validation does not work here. If you train on 2024 data and validate on 2022, the model has already seen the future, which is one of the fastest ways to build a model which performs great in testing but fails in reality. Walk-forward validation trains on all data before a given season and validates on that season only, which mirrors exactly what the prediction task requires. I validated across six seasons: 2019, 2021, 2022, 2023, 2024, and 2025, skipping 2020 because the tournament was cancelled that year for reasons I am sure everyone has forgotten by now. Recent seasons were weighted more heavily since the game evolves year to year.</p>

<h3>Feature Engineering</h3>

<p>All features were computed as differentials (Team A minus Team B) to keep the model focused on relative team quality. None of these features are exotic individually, but together they describe three things: how good a team is, how consistent they are, and how they perform against strong opponents:</p>

<ul>
<li>MOV-adjusted ELO, using a FiveThirtyEight-style margin-of-victory correction</li>
<li>Pythagorean win percentage and last-10-game momentum</li>
<li>Strength of schedule, consistency, and volatility</li>
<li>Seed matchup win rates — historical, recent 5-year, and recent 10-year windows</li>
<li>Multi-dimensional performance gap analysis across key seasonal metrics</li>
</ul>

<p>None of these features are secret. What matters is how they work together to describe the relative quality and momentum of two teams heading into a neutral-site elimination game.</p>

<h2>Where the Magic Happened</h2>

<p>Five models. One ensemble. And more compute time than a free account would allow.</p>

<p>I trained five models independently: LightGBM, XGBoost, HistGradientBoosting, Logistic Regression, and a Neural Network. Each model saw the same features and the same walk-forward validation scheme. The question was not which model to use but rather how much to trust each one.</p>

<p>Rather than averaging the predictions equally, I used <a href="https://optuna.org/">Optuna</a> to optimize the ensemble weights separately for men and women, minimizing Brier score on the walk-forward predictions. This is important because not all models fail in the same way, and weighting them properly lets you keep their strengths while minimizing their blind spots. Think of this as "smoothing the edges" on the predictions across the models. These are the results:</p>

<table>
<thead>
<tr><th>Model</th><th>Men</th><th>Women</th></tr>
</thead>
<tbody>
<tr><td>LightGBM</td><td>58.4%</td><td>34.0%</td></tr>
<tr><td>Logistic Regression</td><td>21.9%</td><td>8.5%</td></tr>
<tr><td>XGBoost</td><td>18.4%</td><td>10.7%</td></tr>
<tr><td>Neural Network</td><td>0.1%</td><td>43.9%</td></tr>
<tr><td>HistGradientBoosting</td><td>1.3%</td><td>2.8%</td></tr>
</tbody>
</table>

<p><br /></p>

<p>A few things stand out here.</p>

<p>LightGBM dominated the men's side at 58.4%. No surprise, as it was the best individual model throughout tuning. Logistic Regression contributed a meaningful 21.9%, which tells you something about the value of a simple linear model when your features are well constructed.</p>

<p>The Neural Network result is the most interesting story in the table. For men, Optuna effectively ignored it, 0.1% weight is a rounding error. For women, it carried 43.9% of the load. This suggests the women's game has non-linear patterns the tree models simply do not capture. Different datasets reward different modeling assumptions, and assuming one approach works everywhere is an easy way to plateau. Whether this is due to differences in pace, efficiency, or seed dominance, I cannot say with certainty. But the data was clear.</p>

<p>HistGradientBoosting was essentially noise at 1-3% across both genders. Next year I would either force it to find a different signal or drop it entirely in favor of more tuning time on LightGBM.</p>

<p>The ensemble Brier score of 0.1203942 beat every individual model. That is the point of an ensemble, not to find the best single model, but to combine models and build a system which is more reliable than any single model would be on its own.</p>

<h2>The Insight — Or, How I Learned to Stop Being Clever</h2>

<p>I played basketball. I coached basketball. And when I first entered this competition years ago I was certain my domain expertise would give me an edge over the data scientists who had never watched a college game in their lives.</p>

<p>I was wrong. Very, very wrong.</p>

<p>It turns out knowing basketball does not help you predict basketball outcomes any better than someone who has never seen a game, provided they know how to collect, transform, and analyze data properly. The sport has too much variance. The tournament has too much chaos. And the things I thought I knew, which teams were dangerous, which matchups favored underdogs, and when to trust a double-digit seed was just noise dressed up as intuition.</p>

<p>The humbling moment came when I started looking at my predictions for upset-prone matchups. My instinct, informed by years of watching March Madness, was to adjust my model's predictions to account for the possibility of an upset. If my model said a 1-seed had a 93% chance of winning, and I knew from experience upsets happen, why not nudge that number down a bit? Give the 9-seed a fighting chance in the predictions, just like they sometimes get in real life!</p>

<p>Remember the MS in mathematics I have? Yeah, so I did the math on this idea.</p>

<p>It turns out this instinct, however well-intentioned, is mathematically guaranteed to make your Brier score worse. Every time. Without exception. I wrote a short explanation of this on Kaggle which you can read <a href="https://www.kaggle.com/competitions/march-machine-learning-mania-2026/discussion/684446">here</a>, but the short version is this: any manual adjustment makes your score worse on average. It does not matter if you are trying to account for an upset, or injuries, or anything. If you alter the model predicitons after they are output, you hurt yourself more often than not. And the penalty grows larger the further you alter your predicition from the true value.</p>

<p>But the lesson was not just about upset predictions. It was bigger than that. Being a subject matter expert is not enough. Sure, it helps you ask better questions and interpret results more intelligently. But it is no substitute for knowing how to build models properly. Once I stopped trying to be clever and started trusting the data, my results improved.</p>

<p>Domain expertise and analytical rigor are not competing advantages. They are complementary ones. It just took me a few years of finishing in the middle of the pack to figure that out.</p>

<h2>A Word on Tools</h2>

<p>I used large language models throughout this project. For coding assistance, debugging, and as a sounding board when I was working through methodology decisions. I am not going to pretend otherwise, and I do not think there is anything to be ashamed of in saying so. Kaggle themselves published a starter notebook this year built around Gemini API calls, so the use of LLMs in this competition was hardly a secret.</p>

<p>The key is knowing enough to have a productive conversation. I shared context about my data, my validation scheme, and my methodology decisions. In return the models offered approaches I had not considered, caught errors I had missed, and helped me think through problems from angles I would not have found on my own. This was not a workflow where the human is in charge and the AI is a servant. It was a genuine collaboration, and knowing when to trust the output versus when to push back is itself a skill. A skill which will be in demand more in the near future.</p>

<p>That skill comes from experience. Graduate-level coursework in statistics, machine learning, and data engineering gave me the foundation to evaluate what the tools were telling me. I knew when the output was good, when it was plausible but wrong, and when to ask again.</p>

<p>LLMs did not finish 21st at Kaggle. I did. The tools helped me get there faster.</p>

<h2>Lessons Learned and What's Next</h2>

<p>A few things I want to do differently next year.</p>

<p>HistGradientBoosting earned 1-3% ensemble weight across both genders. That is not a model contributing signal, that is a model taking up compute time. Next year it gets dropped or rebuilt from scratch with a fundamentally different approach. Five models sounds impressive. Four well-tuned models beat five redundant ones every time.</p>

<p>Massey Ordinals are sitting in the Kaggle data and I never used them. They represent a rich source of cross-season team quality rankings compiled by people who think about this more carefully than I do. That is low-hanging fruit I plan to pick next year.</p>

<p>Multiple seeds per model is something I want to explore. The 10th place solution this year used six random seeds per model and averaged the results. If LightGBM is performing well, how much of that is the model and how much is a fortunate random seed? Running multiple seeds adds diversity without adding new models, and the compute cost is manageable.</p>

<p>I also want to incorporate Polymarket data. Prediction markets aggregate the collective judgment of people with money on the line, which is a different and potentially complementary signal to anything a model trained on box scores can produce. Whether that signal survives feature selection is an open question, but it is worth finding out.</p>

<p>And the upset injection proof is now a permanent part of my toolkit. Not because I needed a mathematical proof to tell me to trust my model, but because having one means I will never second-guess it again in the heat of the tournament. There is something freeing about knowing the math is on your side.</p>

<p>What this competition reinforced for me is that good modeling is less about clever ideas and more about disciplined execution. Validation that matches reality, features that reflect the problem, and systems which combine models intelligently.</p>

<p>21st place is a good result, but not a finished result. I will be back next March with better features, a cleaner ensemble, and if Duke does not choke (again), a better result.</p>]]></content><author><name></name></author><category term="Data Analytics" /><summary type="html"><![CDATA[Every March, data scientists and sports fans collide on Kaggle. This year, I came out ahead of 3,464 of them. 21st place out of 3,485 entries. Top 1%. I'll take it. This is how I did it. Why Am I Even Doing This? I have an MS in Mathematics, way before some hipster decided to rename "statistics" as "data science". I spent the better part of a decade as a database administrator before deciding I wanted to do more with data than store it. About ten years ago I started consuming and learning all things data science, and lurking around other data folks at places like Kaggle. As you read this I am finishing my second MS degree, this one in Data Analytics from Georgia Tech, I graduate in a few weeks. Now, I am not saying I spent $10,000+ and three-plus years of my life just to get better at Kaggle competitions. But, I am not not saying that either. The Kaggle March Machine Learning Mania competition is a good proving ground. It is time-boxed, the data is clean, the scoring is well-defined, and the competition is deep. This year there were 3,485 entries; not a trivial field. There are serious data scientists in that pool. People who do this professionally, people with larger compute budgets, people with more elegant solutions than mine. Finishing in the top 1% means something. Well, it does to me, at least. It also means I have to write this post, now, because when I finish 2000th next year I will want people to forget I ever mentioned it. The Approach Let me walk you through how I built this, and more importantly, why I made the decisions I did. The competition asks you to submit a prediction for every possible matchup between two teams in both the Men's and Women's tournaments. With 64 teams in each field, the submission contains 132,133 entries. Each entry has a team identifier and a probability between 0 and 1, representing the likelihood that the lower-seeded team ID wins the game, should these two teams meet. You do not pick teams to advance, you measure their probability of winning any given game. Honestly, this is more fun than a traditional bracket challenge. The competition is scored using the Brier score. Unlike accuracy, which only cares about right or wrong, the Brier score rewards how confident and calibrated your predictions are. A lower Brier score is better. A perfect model scores 0. A model predicting 50/50 for every game scores 0.25. My final score was 0.1203942, which was the average of the two results for Men (0.1416504) and Women (0.0991382). This is another way of saying I was right on 46 (out of 63) games for the men, and 55 games for the women. The easiest approach to the competition is to train a model, output some predictions, and call it a day. Some people do exactly that and get decent results. The problem with this method is simple: a model trained carelessly will learn things which are not true, and you only find out after the games are played. A few deliberate choices made the difference for me. Symmetric Training Data Every game appears twice in my training data, once with Team A listed first, once with Team B. Without this, the model can quietly learn that “being listed first” correlates with winning, which is obviously nonsense but surprisingly easy for a model to pick up. This doubled the training data and also eliminated perspective bias. Also, I focused exclusively on differentials rather than raw values. For example, instead of using each team's average points scored, I used the scoring gap between the two teams. This gives the model the right context to find meaningful patterns in a head-to-head matchup. Walk-Forward Validation Standard cross-validation does not work here. If you train on 2024 data and validate on 2022, the model has already seen the future, which is one of the fastest ways to build a model which performs great in testing but fails in reality. Walk-forward validation trains on all data before a given season and validates on that season only, which mirrors exactly what the prediction task requires. I validated across six seasons: 2019, 2021, 2022, 2023, 2024, and 2025, skipping 2020 because the tournament was cancelled that year for reasons I am sure everyone has forgotten by now. Recent seasons were weighted more heavily since the game evolves year to year. Feature Engineering All features were computed as differentials (Team A minus Team B) to keep the model focused on relative team quality. None of these features are exotic individually, but together they describe three things: how good a team is, how consistent they are, and how they perform against strong opponents: MOV-adjusted ELO, using a FiveThirtyEight-style margin-of-victory correction Pythagorean win percentage and last-10-game momentum Strength of schedule, consistency, and volatility Seed matchup win rates — historical, recent 5-year, and recent 10-year windows Multi-dimensional performance gap analysis across key seasonal metrics None of these features are secret. What matters is how they work together to describe the relative quality and momentum of two teams heading into a neutral-site elimination game. Where the Magic Happened Five models. One ensemble. And more compute time than a free account would allow. I trained five models independently: LightGBM, XGBoost, HistGradientBoosting, Logistic Regression, and a Neural Network. Each model saw the same features and the same walk-forward validation scheme. The question was not which model to use but rather how much to trust each one. Rather than averaging the predictions equally, I used Optuna to optimize the ensemble weights separately for men and women, minimizing Brier score on the walk-forward predictions. This is important because not all models fail in the same way, and weighting them properly lets you keep their strengths while minimizing their blind spots. Think of this as "smoothing the edges" on the predictions across the models. These are the results: ModelMenWomen LightGBM58.4%34.0% Logistic Regression21.9%8.5% XGBoost18.4%10.7% Neural Network0.1%43.9% HistGradientBoosting1.3%2.8% A few things stand out here. LightGBM dominated the men's side at 58.4%. No surprise, as it was the best individual model throughout tuning. Logistic Regression contributed a meaningful 21.9%, which tells you something about the value of a simple linear model when your features are well constructed. The Neural Network result is the most interesting story in the table. For men, Optuna effectively ignored it, 0.1% weight is a rounding error. For women, it carried 43.9% of the load. This suggests the women's game has non-linear patterns the tree models simply do not capture. Different datasets reward different modeling assumptions, and assuming one approach works everywhere is an easy way to plateau. Whether this is due to differences in pace, efficiency, or seed dominance, I cannot say with certainty. But the data was clear. HistGradientBoosting was essentially noise at 1-3% across both genders. Next year I would either force it to find a different signal or drop it entirely in favor of more tuning time on LightGBM. The ensemble Brier score of 0.1203942 beat every individual model. That is the point of an ensemble, not to find the best single model, but to combine models and build a system which is more reliable than any single model would be on its own. The Insight — Or, How I Learned to Stop Being Clever I played basketball. I coached basketball. And when I first entered this competition years ago I was certain my domain expertise would give me an edge over the data scientists who had never watched a college game in their lives. I was wrong. Very, very wrong. It turns out knowing basketball does not help you predict basketball outcomes any better than someone who has never seen a game, provided they know how to collect, transform, and analyze data properly. The sport has too much variance. The tournament has too much chaos. And the things I thought I knew, which teams were dangerous, which matchups favored underdogs, and when to trust a double-digit seed was just noise dressed up as intuition. The humbling moment came when I started looking at my predictions for upset-prone matchups. My instinct, informed by years of watching March Madness, was to adjust my model's predictions to account for the possibility of an upset. If my model said a 1-seed had a 93% chance of winning, and I knew from experience upsets happen, why not nudge that number down a bit? Give the 9-seed a fighting chance in the predictions, just like they sometimes get in real life! Remember the MS in mathematics I have? Yeah, so I did the math on this idea. It turns out this instinct, however well-intentioned, is mathematically guaranteed to make your Brier score worse. Every time. Without exception. I wrote a short explanation of this on Kaggle which you can read here, but the short version is this: any manual adjustment makes your score worse on average. It does not matter if you are trying to account for an upset, or injuries, or anything. If you alter the model predicitons after they are output, you hurt yourself more often than not. And the penalty grows larger the further you alter your predicition from the true value. But the lesson was not just about upset predictions. It was bigger than that. Being a subject matter expert is not enough. Sure, it helps you ask better questions and interpret results more intelligently. But it is no substitute for knowing how to build models properly. Once I stopped trying to be clever and started trusting the data, my results improved. Domain expertise and analytical rigor are not competing advantages. They are complementary ones. It just took me a few years of finishing in the middle of the pack to figure that out. A Word on Tools I used large language models throughout this project. For coding assistance, debugging, and as a sounding board when I was working through methodology decisions. I am not going to pretend otherwise, and I do not think there is anything to be ashamed of in saying so. Kaggle themselves published a starter notebook this year built around Gemini API calls, so the use of LLMs in this competition was hardly a secret. The key is knowing enough to have a productive conversation. I shared context about my data, my validation scheme, and my methodology decisions. In return the models offered approaches I had not considered, caught errors I had missed, and helped me think through problems from angles I would not have found on my own. This was not a workflow where the human is in charge and the AI is a servant. It was a genuine collaboration, and knowing when to trust the output versus when to push back is itself a skill. A skill which will be in demand more in the near future. That skill comes from experience. Graduate-level coursework in statistics, machine learning, and data engineering gave me the foundation to evaluate what the tools were telling me. I knew when the output was good, when it was plausible but wrong, and when to ask again. LLMs did not finish 21st at Kaggle. I did. The tools helped me get there faster. Lessons Learned and What's Next A few things I want to do differently next year. HistGradientBoosting earned 1-3% ensemble weight across both genders. That is not a model contributing signal, that is a model taking up compute time. Next year it gets dropped or rebuilt from scratch with a fundamentally different approach. Five models sounds impressive. Four well-tuned models beat five redundant ones every time. Massey Ordinals are sitting in the Kaggle data and I never used them. They represent a rich source of cross-season team quality rankings compiled by people who think about this more carefully than I do. That is low-hanging fruit I plan to pick next year. Multiple seeds per model is something I want to explore. The 10th place solution this year used six random seeds per model and averaged the results. If LightGBM is performing well, how much of that is the model and how much is a fortunate random seed? Running multiple seeds adds diversity without adding new models, and the compute cost is manageable. I also want to incorporate Polymarket data. Prediction markets aggregate the collective judgment of people with money on the line, which is a different and potentially complementary signal to anything a model trained on box scores can produce. Whether that signal survives feature selection is an open question, but it is worth finding out. And the upset injection proof is now a permanent part of my toolkit. Not because I needed a mathematical proof to tell me to trust my model, but because having one means I will never second-guess it again in the heat of the tournament. There is something freeing about knowing the math is on your side. What this competition reinforced for me is that good modeling is less about clever ideas and more about disciplined execution. Validation that matches reality, features that reflect the problem, and systems which combine models intelligently. 21st place is a good result, but not a finished result. I will be back next March with better features, a cleaner ensemble, and if Duke does not choke (again), a better result.]]></summary></entry><entry><title type="html">Microsoft Fabric is the New Office</title><link href="https://sqlrockstar.github.io/2024/07/microsoft-fabric-is-the-new-office/" rel="alternate" type="text/html" title="Microsoft Fabric is the New Office" /><published>2024-07-11T12:35:38-04:00</published><updated>2024-07-11T12:35:38-04:00</updated><id>https://sqlrockstar.github.io/2024/07/microsoft-fabric-is-the-new-office</id><content type="html" xml:base="https://sqlrockstar.github.io/2024/07/microsoft-fabric-is-the-new-office/"><![CDATA[<link rel="icon" type="image/x-icon" href="/gravatar.png" />

<p>At Microsoft Build in 2023 the world first heard about a new offering from Microsoft called <a href="https://learn.microsoft.com/en-us/fabric/get-started/microsoft-fabric-overview?WT.mc_id=twitter&amp;sharingId=DP-MVP-4025219" target="_blank" rel="noreferrer noopener">Microsoft Fabric</a>. Reactions to the announcement ranged from “meh” to “what is this?” To be fair, this is the typical reaction most people have when you talk data with them.</p>
<p>Many of us had no idea what to make of Fabric. To me, it seemed as if Microsoft were doing a rebranding of sorts. They changed the name of Azure Synapse Analytics, also called a Dedicated SQL Pool, and previously known as Azure SQL Data Warehouse. Microsoft excels (ha!) at renaming products every 18 months, keeping customers guessing if anyone is leading product marketing.</p>
<p>Microsoft Fabric also came with this thing called <a href="https://learn.microsoft.com/en-us/fabric/onelake/onelake-overview?WT.mc_id=twitter&amp;sharingId=DP-MVP-4025219" target="_blank" rel="noreferrer noopener">OneLake</a>, a place for all your company data. Folks with an eye on data security, privacy, and governance thought the idea of OneLake was madness. The idea of combining all your company data into one big bucket seemed like a lot of administrative overhead. But OneLake also offers a way to separate storage and compute, allowing for greater scalability. This is a must-have when you are competing with companies like Databricks and Snowflake, and other cloud service providers such as AWS and Google.</p>
<h2 class="wp-block-heading">After Some Thought...</h2>
<p>After the dust had settled and time passed, the launch and concept of Fabric started to make more sense. For the past 15+ years, Microsoft has been building the individual pieces of Fabric. Here’s a handful of features and services Fabric contains:</p>
<ul> <li>Data Warehouse/Lakehouse – the storing of large volumes of structured and unstructured data in OneLake, which separates storage and compute</li>   <li>Real-time analytics – the ability to stream data into OneLake, or pull data from external sources such as SnowFlake</li>   <li>Data Engineering – the ability to extract, load, and transform data including the use of notebooks</li>   <li>Data Science – leverage machine learning to gain insights from your data</li>   <li>PowerBI – create interactive reports and dashboards</li> </ul>
<p>Many of these services were built to support traditional data storage, retrieval, and analytical processing. This type of data processing focuses on data at rest, as opposed to streaming event data. This is not to say you couldn’t use these services for streaming, you could try if you wanted. After all, the building blocks for real-time analytics go back to SQL Server 2008, with the release of <a href="https://learn.microsoft.com/en-us/archive/msdn-magazine/2012/march/microsoft-streaminsight-building-the-internet-of-things?WT.mc_id=twitter&amp;sharingId=DP-MVP-4025219" target="_blank" rel="noreferrer noopener">StreamInsight</a>, a fancy way to build pipelines for refreshing dashboards with up to date data.</p>
<p>Streaming event data is where the real data race is taking place today. According to the IDC, by 2025 <a href="https://www.zdnet.com/article/by-2025-nearly-30-percent-of-data-generated-will-be-real-time-idc-says/">nearly 30% of data will need real-time processing</a>. This is the market Microsoft, among others, is targeting, which is roughly 54 ZB in size.</p>
<figure class="wp-block-image size-large"><img src="https://sqlrockstar.github.io/wp-content/uploads/2024/07/image-600x389.png" alt="" class="wp-image-29270" /></figure>
<p>So, it seems the more data collected, the more likely it is used for real-time processing. Therefore, if you are a cloud company, it is rather important to your bottom line to find a way to make it easy for your customers to store their data in your cloud. The next best thing, of course, is making it easy for your customers to use your tools and services to work with data stored elsewhere. This is part of the brilliance of Fabric, as it allows ease of access to real time data you are already using in places like Databricks, Confluent, and Snowflake.</p>
<h2 class="wp-block-heading">The Bundle</h2>
<p>Now, if you are Microsoft, with a handful of data services ready to meet the needs of a growing market, you have some choices to make. You could continue to do what you have done for 15+ years and keep selling individual products and services and hope you earn some of the market going forward. Or you could bundle the products and services, unifying them into one platform, and make it easy for users to ingest, transform, analyze, and report on their data.</p>
<p>Well, if you want to gain market share, bundling makes the most sense. And Microsoft is uniquely positioned to pull this off for two reasons. First, they have a comprehensive data platform which is second to none. Sure, you can point to other companies who might do one of those services better, but there is no company on Earth, or in the Cloud, which offers a complete end-to-end data platform like Fabric.</p>
<p>Second, bundling software is something Microsoft has a history of doing, and doing it quite well in some cases. People reading this post in 2024 may not be old enough to recall a time when you purchased individual software products like Excel and Word. But I do recall the time before Microsoft Office existed. Bundling everything into Fabric allows users to work with their data anywhere and, most importantly to Microsoft’s bottom line, the result is more data flowing to Azure servers.</p>
<p>I am not here to tell you everything is perfect with Fabric. In the past year I have seen a handful of negative comments about Fabric, most of them nitpicking about things like brand names, data type support, and file formats. There is always going to be a person upset about how Widget X isn’t the Most Perfect Thing For Them at This Moment and They Need to Tell the World. I think most people believe when a product is released, even if it is marked as “Preview”, it should be able to meet the demands of every possible user. It is just not practical.</p>
<h2 class="wp-block-heading">Summary</h2>
<p>Microsoft Fabric was announced at Build this year to be GA, which also makes users believe it should meet the demands of every possible user. The fastest way for Microsoft to grab as much market share as possible is to focus on the customer experience and remove those barriers. You can find roadmap details <a href="https://learn.microsoft.com/en-us/fabric/release-plan/overview?WT.mc_id=twitter&amp;sharingId=DP-MVP-4025219" target="_blank" rel="noreferrer noopener">here</a>, giving you an idea about the effort going on behind the scenes with Fabric today. For example, for everyone who has raised issues with security and governance, you can see the list of what has shipped and what is planned <a href="https://learn.microsoft.com/en-us/fabric/release-plan/admin-governance?WT.mc_id=twitter&amp;sharingId=DP-MVP-4025219" target="_blank" rel="noreferrer noopener">here</a>.</p>
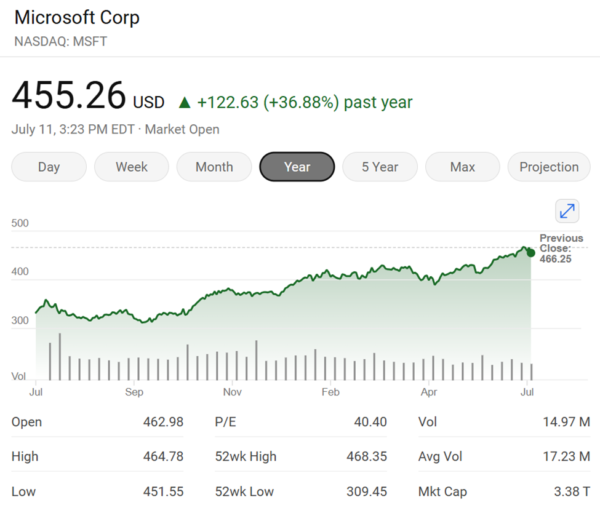
<p>It is clear Microsoft is investing in Fabric, much like they invested in Office 30+ years ago. If there is one thing Microsoft knows how to do, it is creating value for shareholders:</p>
<figure class="wp-block-image size-large"><img src="https://thomaslarock.com/wp-content/uploads/2024/07/image-1-600x513.png" alt="" class="wp-image-29271" /></figure>
<p>Since the announcement of Fabric last May, Microsoft is up over 25%. I am not going to say the increase is the direct result of Fabric. What I am saying is Microsoft might have an idea about what they are doing, and why.</p>
<p>Microsoft Fabric is the new Office – it is a bundle of data products, meant to boost productivity for data professionals and dominate the data analytics landscape. Much in the same way Office dominates the business world.</p>]]></content><author><name></name></author><category term="Azure" /><category term="Data Analytics" /><category term="SQL MVP" /><summary type="html"><![CDATA[At Microsoft Build in 2023 the world first heard about a new offering from Microsoft called Microsoft Fabric. Reactions to the announcement ranged from “meh” to “what is this?” To be fair, this is the typical reaction most people have when you talk data with them. Many of us had no idea what to make of Fabric. To me, it seemed as if Microsoft were doing a rebranding of sorts. They changed the name of Azure Synapse Analytics, also called a Dedicated SQL Pool, and previously known as Azure SQL Data Warehouse. Microsoft excels (ha!) at renaming products every 18 months, keeping customers guessing if anyone is leading product marketing. Microsoft Fabric also came with this thing called OneLake, a place for all your company data. Folks with an eye on data security, privacy, and governance thought the idea of OneLake was madness. The idea of combining all your company data into one big bucket seemed like a lot of administrative overhead. But OneLake also offers a way to separate storage and compute, allowing for greater scalability. This is a must-have when you are competing with companies like Databricks and Snowflake, and other cloud service providers such as AWS and Google. After Some Thought... After the dust had settled and time passed, the launch and concept of Fabric started to make more sense. For the past 15+ years, Microsoft has been building the individual pieces of Fabric. Here’s a handful of features and services Fabric contains: Data Warehouse/Lakehouse – the storing of large volumes of structured and unstructured data in OneLake, which separates storage and compute Real-time analytics – the ability to stream data into OneLake, or pull data from external sources such as SnowFlake Data Engineering – the ability to extract, load, and transform data including the use of notebooks Data Science – leverage machine learning to gain insights from your data PowerBI – create interactive reports and dashboards Many of these services were built to support traditional data storage, retrieval, and analytical processing. This type of data processing focuses on data at rest, as opposed to streaming event data. This is not to say you couldn’t use these services for streaming, you could try if you wanted. After all, the building blocks for real-time analytics go back to SQL Server 2008, with the release of StreamInsight, a fancy way to build pipelines for refreshing dashboards with up to date data. Streaming event data is where the real data race is taking place today. According to the IDC, by 2025 nearly 30% of data will need real-time processing. This is the market Microsoft, among others, is targeting, which is roughly 54 ZB in size. So, it seems the more data collected, the more likely it is used for real-time processing. Therefore, if you are a cloud company, it is rather important to your bottom line to find a way to make it easy for your customers to store their data in your cloud. The next best thing, of course, is making it easy for your customers to use your tools and services to work with data stored elsewhere. This is part of the brilliance of Fabric, as it allows ease of access to real time data you are already using in places like Databricks, Confluent, and Snowflake. The Bundle Now, if you are Microsoft, with a handful of data services ready to meet the needs of a growing market, you have some choices to make. You could continue to do what you have done for 15+ years and keep selling individual products and services and hope you earn some of the market going forward. Or you could bundle the products and services, unifying them into one platform, and make it easy for users to ingest, transform, analyze, and report on their data. Well, if you want to gain market share, bundling makes the most sense. And Microsoft is uniquely positioned to pull this off for two reasons. First, they have a comprehensive data platform which is second to none. Sure, you can point to other companies who might do one of those services better, but there is no company on Earth, or in the Cloud, which offers a complete end-to-end data platform like Fabric. Second, bundling software is something Microsoft has a history of doing, and doing it quite well in some cases. People reading this post in 2024 may not be old enough to recall a time when you purchased individual software products like Excel and Word. But I do recall the time before Microsoft Office existed. Bundling everything into Fabric allows users to work with their data anywhere and, most importantly to Microsoft’s bottom line, the result is more data flowing to Azure servers. I am not here to tell you everything is perfect with Fabric. In the past year I have seen a handful of negative comments about Fabric, most of them nitpicking about things like brand names, data type support, and file formats. There is always going to be a person upset about how Widget X isn’t the Most Perfect Thing For Them at This Moment and They Need to Tell the World. I think most people believe when a product is released, even if it is marked as “Preview”, it should be able to meet the demands of every possible user. It is just not practical. Summary Microsoft Fabric was announced at Build this year to be GA, which also makes users believe it should meet the demands of every possible user. The fastest way for Microsoft to grab as much market share as possible is to focus on the customer experience and remove those barriers. You can find roadmap details here, giving you an idea about the effort going on behind the scenes with Fabric today. For example, for everyone who has raised issues with security and governance, you can see the list of what has shipped and what is planned here. It is clear Microsoft is investing in Fabric, much like they invested in Office 30+ years ago. If there is one thing Microsoft knows how to do, it is creating value for shareholders: Since the announcement of Fabric last May, Microsoft is up over 25%. I am not going to say the increase is the direct result of Fabric. What I am saying is Microsoft might have an idea about what they are doing, and why. Microsoft Fabric is the new Office – it is a bundle of data products, meant to boost productivity for data professionals and dominate the data analytics landscape. Much in the same way Office dominates the business world.]]></summary></entry><entry><title type="html">Book Review: The AI Playbook</title><link href="https://sqlrockstar.github.io/2024/02/book-review-the-ai-playbook/" rel="alternate" type="text/html" title="Book Review: The AI Playbook" /><published>2024-02-27T03:38:58-05:00</published><updated>2024-02-27T03:38:58-05:00</updated><id>https://sqlrockstar.github.io/2024/02/book-review-the-ai-playbook</id><content type="html" xml:base="https://sqlrockstar.github.io/2024/02/book-review-the-ai-playbook/"><![CDATA[<p>Imagine you conceive an idea which will save your company millions of dollars, reduce workplace injuries, and increase sales. Now imagine company executives dislike the idea because it seems difficult to implement, and the implementation details are not well understood. Despite the stated benefits of saving money, reducing injuries, and increasing sales your idea hits a brick wall and falls flat.</p>
<p>Welcome to the world of artificial intelligence (AI) and machine learning (ML), where the struggle is real.</p>
<p>At some point in your career, you have experienced a failed project. If not, don’t worry, you will. Projects fail for all sorts of reasons. Unclear objectives. Unrealistic expectations. Poor planning. Lack of resources. Scope creep. Just to name a few of the more common reasons.</p>
<p>When it comes to projects with AI/ML at the core, all those same reasons apply, plus a few new ones. AI/ML is perhaps the most important piece of general-purpose technology today, which means we are bombarded with AI/ML solutions to solve random or ill-defined problems in much the same way we are bombarded by blockchain solutions for tracking fruit trucks or <a href="https://www.digitaltrends.com/computing/dentacoin-bitcoin-for-dentistry-patients/" target="_blank" rel="noreferrer noopener">visiting the dentist</a>.</p>
<p>The overhype of AI/ML has left people skeptical regarding the promises made through project proposals. Even if you manage to get a project funded, the initial results produced by your model may be difficult to explain, leading to apprehension about deploying solutions which cannot be understood. Nobody wants to blindly follow the decisions and predictions produced by machine learning models no one understands.</p>
<p>It is clear the business world needs a way to build, deploy, and maintain AI/ML models in a consistent manner, with a higher rate of success than failure, and completed on time and within budget.</p>
<h2 class="wp-block-heading" id="h-bizml" style="text-transform:none">bizML</h2>
<p>Thankfully, there exists a modern approach to AI/ML projects. It is called <a href="https://bizml.com" target="_blank" rel="noreferrer noopener">bizML</a>, and it is the core subject inside the new book by Dr. Eric Siegel – <a href="https://amzn.to/3uFR632" target="_blank" rel="noreferrer noopener"><em>The AI Playbook</em></a>.</p>
<p>For any project, not just AI/ML projects, to succeed there must be a rigorous and systematic approach for real-world deployments. Every successful project has similar characteristics - measurable goals, stakeholder involvement, risk management, resource allocation, fighting scope creep, effective communication, and monitoring project progress before, during, and after deployment.</p>
<p>The AI Playbook breaks this down into digestible sections for anyone with business experience to understand. It outlines bizML as a six-step process for guiding AI/ML projects from conception to deployment: define, measure, act, learn, iterate, and deploy. Using stories from familiar companies such as UPS, FICO, and various dot-coms, <a href="https://www.linkedin.com/in/predictiveanalytics/" target="_blank" rel="noreferrer noopener">Dr. Siegel</a> leans on his experience to help the reader understand how and why even the best ideas often fail.</p>
<p>I don’t want to give away the surprise ending, so I will just say the real secret behind bizML is starting with the end state in mind. Many projects fail due to stakeholders not aligned with the reality of deployment versus expectations. bizML attempts to remove this roadblock by getting everyone aligned with what the end state will look like, and then build towards the agreed upon state.</p>
<p>I read through the book in less than a couple of days, absorbing the material as fast as possible. The use of personal stories was easier to read as opposed to a purely technical book focusing on code and examples. I cannot emphasize enough how this book is <strong>not a technical manual</strong>, but a business guide for business professionals, executives, managers, consultants, and anyone else wanting to learn how to capitalize on AI/ML tech and collaborate with data professionals.</p>
<h2 class="wp-block-heading" id="h-summary">Summary</h2>
<p>As AI/ML solutions continue to gain traction in the market, this book provides the right framework (bizML) for successful AI/ML deployments at the right time. Anyone, or any company, looking to deploy (or has deployed) AI/ML projects should buy copies of this book for all stakeholders.</p>
<p>I’m putting this onto my <a href="https://thomaslarock.com/sqlserverbooks/" target="_blank" rel="noreferrer noopener">bookshelf </a>and 15/10 would recommend.</p>]]></content><author><name></name></author><category term="Book Reviews" /><category term="Data Analytics" /><category term="Professional Development" /><summary type="html"><![CDATA[Imagine you conceive an idea which will save your company millions of dollars, reduce workplace injuries, and increase sales. Now imagine company executives dislike the idea because it seems difficult to implement, and the implementation details are not well understood. Despite the stated benefits of saving money, reducing injuries, and increasing sales your idea hits a brick wall and falls flat. Welcome to the world of artificial intelligence (AI) and machine learning (ML), where the struggle is real. At some point in your career, you have experienced a failed project. If not, don’t worry, you will. Projects fail for all sorts of reasons. Unclear objectives. Unrealistic expectations. Poor planning. Lack of resources. Scope creep. Just to name a few of the more common reasons. When it comes to projects with AI/ML at the core, all those same reasons apply, plus a few new ones. AI/ML is perhaps the most important piece of general-purpose technology today, which means we are bombarded with AI/ML solutions to solve random or ill-defined problems in much the same way we are bombarded by blockchain solutions for tracking fruit trucks or visiting the dentist. The overhype of AI/ML has left people skeptical regarding the promises made through project proposals. Even if you manage to get a project funded, the initial results produced by your model may be difficult to explain, leading to apprehension about deploying solutions which cannot be understood. Nobody wants to blindly follow the decisions and predictions produced by machine learning models no one understands. It is clear the business world needs a way to build, deploy, and maintain AI/ML models in a consistent manner, with a higher rate of success than failure, and completed on time and within budget. bizML Thankfully, there exists a modern approach to AI/ML projects. It is called bizML, and it is the core subject inside the new book by Dr. Eric Siegel – The AI Playbook. For any project, not just AI/ML projects, to succeed there must be a rigorous and systematic approach for real-world deployments. Every successful project has similar characteristics - measurable goals, stakeholder involvement, risk management, resource allocation, fighting scope creep, effective communication, and monitoring project progress before, during, and after deployment. The AI Playbook breaks this down into digestible sections for anyone with business experience to understand. It outlines bizML as a six-step process for guiding AI/ML projects from conception to deployment: define, measure, act, learn, iterate, and deploy. Using stories from familiar companies such as UPS, FICO, and various dot-coms, Dr. Siegel leans on his experience to help the reader understand how and why even the best ideas often fail. I don’t want to give away the surprise ending, so I will just say the real secret behind bizML is starting with the end state in mind. Many projects fail due to stakeholders not aligned with the reality of deployment versus expectations. bizML attempts to remove this roadblock by getting everyone aligned with what the end state will look like, and then build towards the agreed upon state. I read through the book in less than a couple of days, absorbing the material as fast as possible. The use of personal stories was easier to read as opposed to a purely technical book focusing on code and examples. I cannot emphasize enough how this book is not a technical manual, but a business guide for business professionals, executives, managers, consultants, and anyone else wanting to learn how to capitalize on AI/ML tech and collaborate with data professionals. Summary As AI/ML solutions continue to gain traction in the market, this book provides the right framework (bizML) for successful AI/ML deployments at the right time. Anyone, or any company, looking to deploy (or has deployed) AI/ML projects should buy copies of this book for all stakeholders. I’m putting this onto my bookshelf and 15/10 would recommend.]]></summary></entry><entry><title type="html">Export to CSV in Azure ML Studio</title><link href="https://sqlrockstar.github.io/2024/01/export-to-csv-in-azure-ml-studio/" rel="alternate" type="text/html" title="Export to CSV in Azure ML Studio" /><published>2024-01-17T10:48:02-05:00</published><updated>2024-01-17T10:48:02-05:00</updated><id>https://sqlrockstar.github.io/2024/01/export-to-csv-in-azure-ml-studio</id><content type="html" xml:base="https://sqlrockstar.github.io/2024/01/export-to-csv-in-azure-ml-studio/"><![CDATA[<p>The most popular feature in any application is an easy-to-find button saying "Export to CSV." If this button is not visibly available, a simple right-click of your mouse should present such an option. You really should not be forced to spend any additional time on this Earth looking for a way to export your data to a CSV file. </p>
<p>Well, in Azure ML Studio, exporting to a CSV file should be simple, but is not, unless you already know what you are doing and where to look. I was reminded of this recently, and decided to write a quick post in case a person new to ML Studio was wondering how to export data to a CSV file. </p>
<p>When you are working inside the ML Studio designer, it is likely you will want to export data or outputs from time to time. If you are starting from a blank template, the designer does not make it easy for you to know what module you need (<a href="https://thomaslarock.com/2024/01/azure-ml-studio-sample-data/" target="_blank" rel="noreferrer noopener">similar to my last post on finding sample data</a>). Would be great if CoPilot was available!</p>
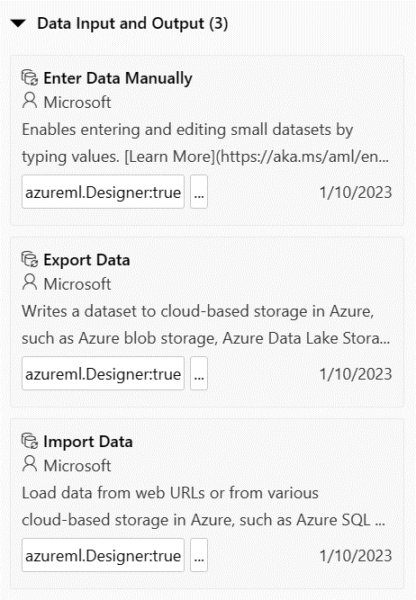
<p>Now, if you are similar to 99% of data professionals in the world, you will navigate to the section named Data Input and Output, because that’s what you are trying to do, export data from the designer. It even says in the description “Writes a dataset to…”, very clear what will happen.</p>
<figure class="wp-block-image aligncenter size-large"><img src="https://thomaslarock.com/wp-content/uploads/2024/01/azure-ml-data-input-and-output-416x600.png" alt="" class="wp-image-28535" /></figure>
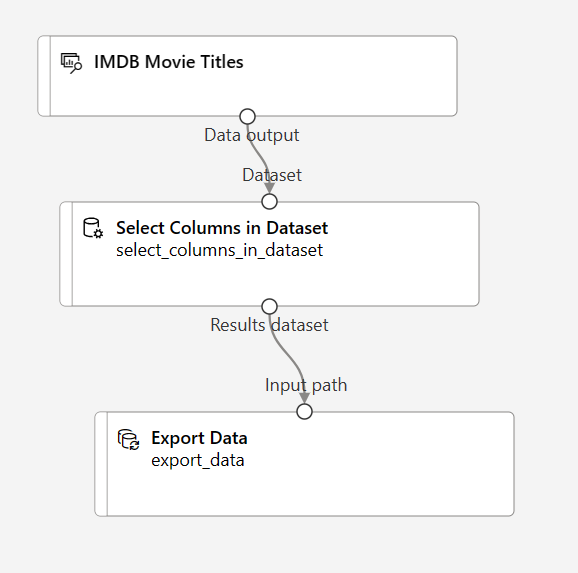
<p>So, using <a href="https://thomaslarock.com/2024/01/azure-ml-studio-sample-data/" target="_blank" rel="noreferrer noopener">the imdb sample data</a>, we add a module to select all columns, then attach the module to the Export Data model. So easy!</p>
<figure class="wp-block-image aligncenter size-full"><img src="https://thomaslarock.com/wp-content/uploads/2024/01/azure-ml-export-data.png" alt="" class="wp-image-28536" /></figure>
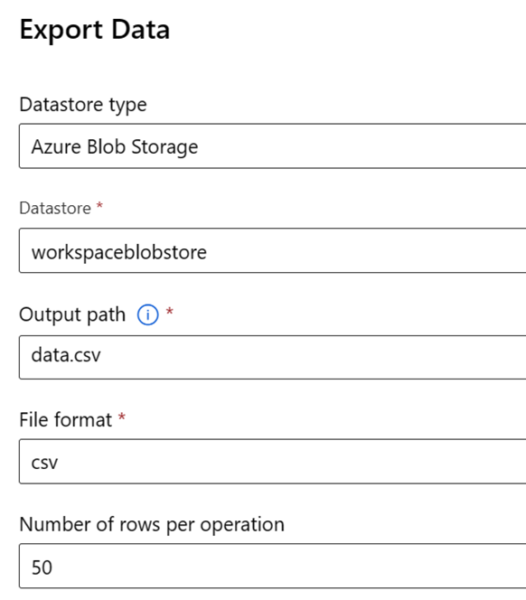
<p>When you attach you need to configure some details for the module. Again, so easy!</p>
<figure class="wp-block-image aligncenter size-large"><img src="https://thomaslarock.com/wp-content/uploads/2024/01/azure-ml-export-data-config-526x600.png" alt="" class="wp-image-28537" /></figure>
<p>We save our configuration options and submit the job to run. When the job is complete, we navigate to view the dataset.</p>
<figure class="wp-block-image aligncenter size-full"><img src="https://thomaslarock.com/wp-content/uploads/2024/01/azure-ml-export-data-output.png" alt="" class="wp-image-28538" /></figure>
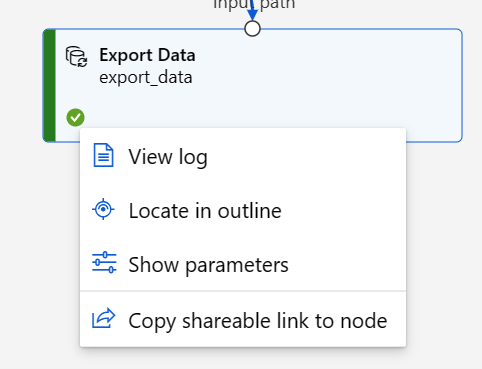
<p>Uh-oh, I was expecting a different set of options here. Viewing the log and various outputs does not reveal any CSV file either. Maybe I need to choose the select columns module:</p>
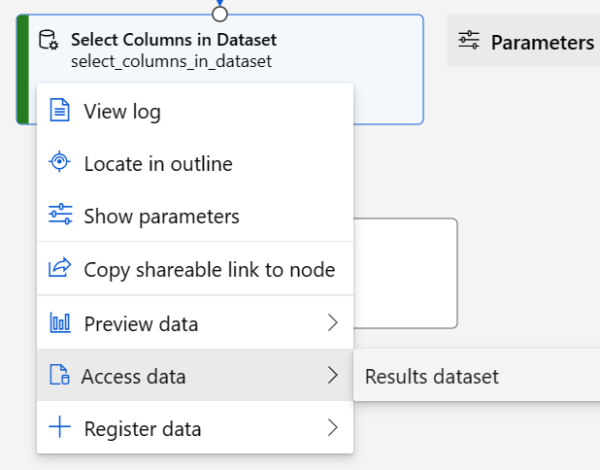
<figure class="wp-block-image aligncenter size-large"><img src="https://thomaslarock.com/wp-content/uploads/2024/01/azure-ml-select-columns-output-600x470.png" alt="" class="wp-image-28539" /></figure>
<p>Ah, that’s better. </p>
<p>Except it isn’t. Instead of showing me the location of the expected CSV file, what I find is this:</p>
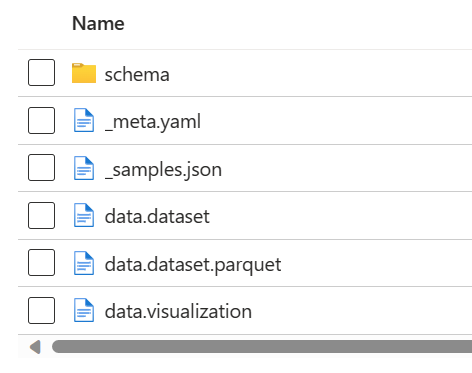
<figure class="wp-block-image aligncenter size-full"><img src="https://thomaslarock.com/wp-content/uploads/2024/01/azure-ml-select-columns-output-2.png" alt="" class="wp-image-28540" /></figure>
<p>I can preview the data from the select columns module, but there isn’t a way to access the CSV file I was expecting. I suspect this export module is really meant to pass data between pipelines or services. But the purpose and description of the export module is not clear, and a novice user would be unhappy to head down this path only to be disappointed and frustrated. </p>
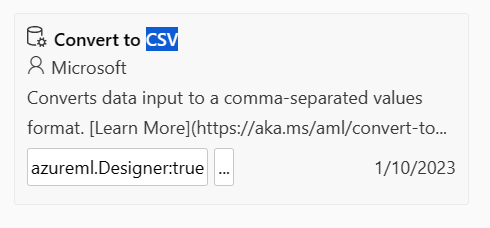
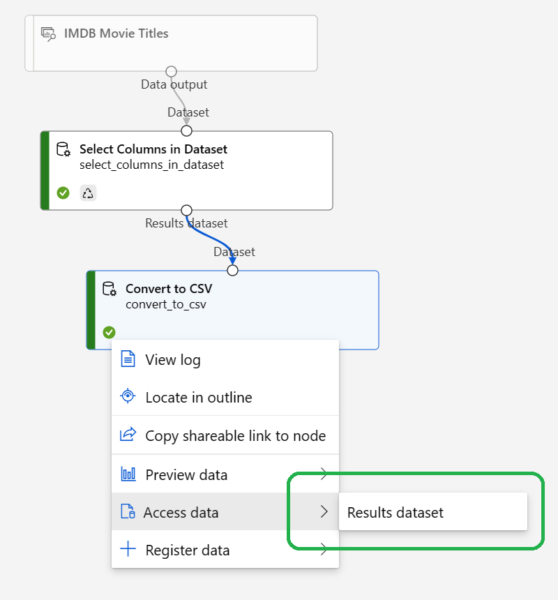
<p>What we really want to use here is the Convert to CSV module:</p>
<figure class="wp-block-image aligncenter size-full is-resized"><img src="https://thomaslarock.com/wp-content/uploads/2024/01/azure-ml-convert-csv.png" alt="" class="wp-image-28541" style="width:490px;height:auto" /></figure>
<figure class="wp-block-image aligncenter size-large"><img src="https://thomaslarock.com/wp-content/uploads/2024/01/azure-ml-convert-csv-module-558x600.png" alt="" class="wp-image-28542" /></figure>
<p>Viewing the results will display this:</p>
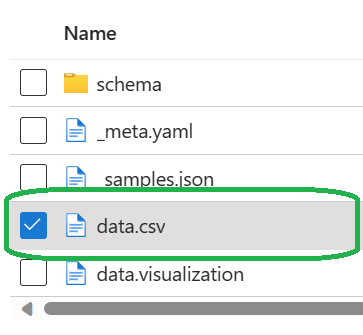
<figure class="wp-block-image aligncenter size-full"><img src="https://thomaslarock.com/wp-content/uploads/2024/01/azure-ml-convert-csv-output.png" alt="" class="wp-image-28543" /></figure>
<p>Which has what we are looking for, a download button:</p>
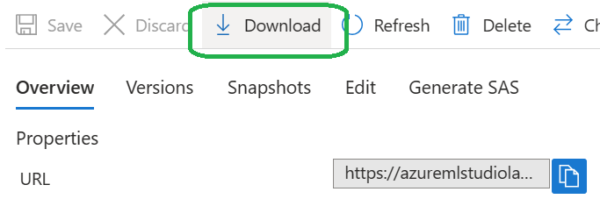
<figure class="wp-block-image aligncenter size-large"><img src="https://thomaslarock.com/wp-content/uploads/2024/01/azure-ml-convert-csv-download-600x199.png" alt="" class="wp-image-28544" /></figure>
<p>Selecting Download will either default to your browser settings, or you can do a Save As. </p>
<p>As I wrote at the beginning of this post, exporting to a CSV file from within Azure ML Studio is easy to do, if you already know what you are doing. If you are new to Azure ML Studio, you may find yourself frustrated if you expect the Export Data module to produce a CSV file. You will want to use the Convert to CSV module instead. </p>]]></content><author><name></name></author><category term="Azure" /><category term="Data Analytics" /><summary type="html"><![CDATA[The most popular feature in any application is an easy-to-find button saying "Export to CSV." If this button is not visibly available, a simple right-click of your mouse should present such an option. You really should not be forced to spend any additional time on this Earth looking for a way to export your data to a CSV file. Well, in Azure ML Studio, exporting to a CSV file should be simple, but is not, unless you already know what you are doing and where to look. I was reminded of this recently, and decided to write a quick post in case a person new to ML Studio was wondering how to export data to a CSV file. When you are working inside the ML Studio designer, it is likely you will want to export data or outputs from time to time. If you are starting from a blank template, the designer does not make it easy for you to know what module you need (similar to my last post on finding sample data). Would be great if CoPilot was available! Now, if you are similar to 99% of data professionals in the world, you will navigate to the section named Data Input and Output, because that’s what you are trying to do, export data from the designer. It even says in the description “Writes a dataset to…”, very clear what will happen. So, using the imdb sample data, we add a module to select all columns, then attach the module to the Export Data model. So easy! When you attach you need to configure some details for the module. Again, so easy! We save our configuration options and submit the job to run. When the job is complete, we navigate to view the dataset. Uh-oh, I was expecting a different set of options here. Viewing the log and various outputs does not reveal any CSV file either. Maybe I need to choose the select columns module: Ah, that’s better. Except it isn’t. Instead of showing me the location of the expected CSV file, what I find is this: I can preview the data from the select columns module, but there isn’t a way to access the CSV file I was expecting. I suspect this export module is really meant to pass data between pipelines or services. But the purpose and description of the export module is not clear, and a novice user would be unhappy to head down this path only to be disappointed and frustrated. What we really want to use here is the Convert to CSV module: Viewing the results will display this: Which has what we are looking for, a download button: Selecting Download will either default to your browser settings, or you can do a Save As. As I wrote at the beginning of this post, exporting to a CSV file from within Azure ML Studio is easy to do, if you already know what you are doing. If you are new to Azure ML Studio, you may find yourself frustrated if you expect the Export Data module to produce a CSV file. You will want to use the Convert to CSV module instead.]]></summary></entry><entry><title type="html">Azure ML Studio Sample Data</title><link href="https://sqlrockstar.github.io/2024/01/azure-ml-studio-sample-data/" rel="alternate" type="text/html" title="Azure ML Studio Sample Data" /><published>2024-01-08T10:17:48-05:00</published><updated>2024-01-08T10:17:48-05:00</updated><id>https://sqlrockstar.github.io/2024/01/azure-ml-studio-sample-data</id><content type="html" xml:base="https://sqlrockstar.github.io/2024/01/azure-ml-studio-sample-data/"><![CDATA[<p>This is one of those posts you write as a note to "future you", when you'll forget something, do a search, and find your own post. </p>
<p>Recently I was working inside of Azure ML Studio and wanted to browse the sample datasets provided. Except I could not find them. I *knew* they existed, having used them previously, but could not remember if that was in the original ML Studio (classic) or not. </p>
<p>After some trial and error, I found them and decided to write this post in case anyone else is wondering where to find the sample datasets. You're welcome, future Tom!</p>
<p>First, you need to login to Azure ML Studio: <a href="https://ml.azure.com/" target="_blank" rel="noreferrer noopener">https://ml.azure.com/</a>. Once logged in, you will create a workspace. Once the workspace is ready, open it and you will see a splash screen with a lot of interesting widgets, but alas no sample datasets to select.</p>
<figure class="wp-block-image aligncenter size-large"><img src="https://thomaslarock.com/wp-content/uploads/2024/01/azure-ml-studio-workspace-600x377.png" alt="" class="wp-image-28480" /></figure>
<p>To locate the sample datasets you must create a Pipeline. You create a Pipeline either through the designer or the Pipeline menu on the left of the workspace screen, as selecting Pipeline | New Pipeline opens the Designer.</p>
<figure class="wp-block-image aligncenter size-large"><img src="https://thomaslarock.com/wp-content/uploads/2024/01/azure-ml-designer-265x600.png" alt="" class="wp-image-28481" /></figure>
<p>Once inside the Designer, create a Pipeline either by selecting the pre-defined samples or by selecting the upper-left tile:</p>
<figure class="wp-block-image aligncenter size-full"><img src="https://thomaslarock.com/wp-content/uploads/2024/01/azure-ml-new-pipeline.png" alt="" class="wp-image-28482" /></figure>
<p>Now you are in the Authoring screen, and here is where you will find the sample data. However, your default portal experience could have the left-hand menu collapsed. You can expand the menu by clicking on the two brackets (WTH is this really called, a vertical chevron? No idea.) This was not intuitive for me, it took me a bit of time to understand I needed to click on this to view a menu.</p>
<figure class="wp-block-image aligncenter size-full"><img src="https://thomaslarock.com/wp-content/uploads/2024/01/azure-ml-designer-authoring-menu.png" alt="" class="wp-image-28483" /></figure>
<p>Once opened, you’ll find sample data as well as some other goodies.</p>
<figure class="wp-block-image aligncenter size-large"><img src="https://thomaslarock.com/wp-content/uploads/2024/01/azure-ml-sample-data-276x600.png" alt="" class="wp-image-28484" /></figure>
<p>Expand the Sample data option and view the full list of datasets.</p>
<figure class="wp-block-image aligncenter size-full"><img src="https://thomaslarock.com/wp-content/uploads/2024/01/azure-ml-sample-data-census.png" alt="" class="wp-image-28485" /></figure>
<p>I don’t know how often the sample data is refreshed, and the answer is “likely never”. So, if you are looking for up to date census data, or iMDB movie data, you should consider a different source than the sample datasets provided through Azure ML Studio.</p>]]></content><author><name></name></author><category term="Azure" /><summary type="html"><![CDATA[This is one of those posts you write as a note to "future you", when you'll forget something, do a search, and find your own post. Recently I was working inside of Azure ML Studio and wanted to browse the sample datasets provided. Except I could not find them. I *knew* they existed, having used them previously, but could not remember if that was in the original ML Studio (classic) or not. After some trial and error, I found them and decided to write this post in case anyone else is wondering where to find the sample datasets. You're welcome, future Tom! First, you need to login to Azure ML Studio: https://ml.azure.com/. Once logged in, you will create a workspace. Once the workspace is ready, open it and you will see a splash screen with a lot of interesting widgets, but alas no sample datasets to select. To locate the sample datasets you must create a Pipeline. You create a Pipeline either through the designer or the Pipeline menu on the left of the workspace screen, as selecting Pipeline | New Pipeline opens the Designer. Once inside the Designer, create a Pipeline either by selecting the pre-defined samples or by selecting the upper-left tile: Now you are in the Authoring screen, and here is where you will find the sample data. However, your default portal experience could have the left-hand menu collapsed. You can expand the menu by clicking on the two brackets (WTH is this really called, a vertical chevron? No idea.) This was not intuitive for me, it took me a bit of time to understand I needed to click on this to view a menu. Once opened, you’ll find sample data as well as some other goodies. Expand the Sample data option and view the full list of datasets. I don’t know how often the sample data is refreshed, and the answer is “likely never”. So, if you are looking for up to date census data, or iMDB movie data, you should consider a different source than the sample datasets provided through Azure ML Studio.]]></summary></entry><entry><title type="html">Microsoft Data Platform MVP - Fifteen Years</title><link href="https://sqlrockstar.github.io/2023/08/microsoft-data-platform-mvp-fifteen-years/" rel="alternate" type="text/html" title="Microsoft Data Platform MVP - Fifteen Years" /><published>2023-08-17T10:53:36-04:00</published><updated>2023-08-17T10:53:36-04:00</updated><id>https://sqlrockstar.github.io/2023/08/microsoft-data-platform-mvp-fifteen-years</id><content type="html" xml:base="https://sqlrockstar.github.io/2023/08/microsoft-data-platform-mvp-fifteen-years/"><![CDATA[<p>I am happy, honored, and humbled to receive the Microsoft Data Platform MVP award for the fifteenth (15th) straight year.</p>
<p>Receiving the MVP award during my unforced sabbatical this summer was a bright spot, no question. It reinforced the belief I have in myself - my contributions have value. Microsoft puts this front and center on the award by stating (emphasis mine):</p>
<p class="has-text-align-left"><em>"We <strong>recognize </strong>and <strong>value </strong>your exceptional contributions to technical communities worldwide."</em></p>
<figure class="wp-block-image aligncenter size-large"><img src="https://thomaslarock.com/wp-content/uploads/2023/08/IMG_9272-449x600.jpg" alt="" class="wp-image-27669" /><figcaption class="wp-element-caption">I'm running out of room.</figcaption></figure>
<p>I recall the aftermath of my first award, when I was told I was the "least technical SQL Server MVP ever awarded". Talk about feeling you have no value! And that was certainly the feeling I had two months ago. </p>
<p>It's amazing how something as simple as being recognized by your peers can go so far in making a person feel valued. We should all strive to go out of our way daily to help another human feel valued. </p>
<p>There are plenty of people in the world who are recognized as experts in the Microsoft Data Platform. I'd like to think I am one of them. I also happen to be fortunate enough to know Microsoft recognizes me as one as well. </p>
<p>But MVPs advocate for Microsoft because we want to, not because we want an award. After all these years I’m still crazy for Microsoft, and I am happy to help promote the best data platform on the planet.</p>
<p>For my fellow MVPs renewed this year, I offer this suggestion - say thank you. Then say it again. Email the person on the product team who made the widget you enjoy using over and over and tell them how much you appreciate their effort. Email your MVP lead(s) and thank them for all their hard work as well.</p>
<p>A little kindness goes a long way. You never know how much reaching out could mean to that person at that moment. </p>]]></content><author><name></name></author><category term="Azure" /><category term="SQL MVP" /><summary type="html"><![CDATA[I am happy, honored, and humbled to receive the Microsoft Data Platform MVP award for the fifteenth (15th) straight year. Receiving the MVP award during my unforced sabbatical this summer was a bright spot, no question. It reinforced the belief I have in myself - my contributions have value. Microsoft puts this front and center on the award by stating (emphasis mine): "We recognize and value your exceptional contributions to technical communities worldwide." I'm running out of room. I recall the aftermath of my first award, when I was told I was the "least technical SQL Server MVP ever awarded". Talk about feeling you have no value! And that was certainly the feeling I had two months ago. It's amazing how something as simple as being recognized by your peers can go so far in making a person feel valued. We should all strive to go out of our way daily to help another human feel valued. There are plenty of people in the world who are recognized as experts in the Microsoft Data Platform. I'd like to think I am one of them. I also happen to be fortunate enough to know Microsoft recognizes me as one as well. But MVPs advocate for Microsoft because we want to, not because we want an award. After all these years I’m still crazy for Microsoft, and I am happy to help promote the best data platform on the planet. For my fellow MVPs renewed this year, I offer this suggestion - say thank you. Then say it again. Email the person on the product team who made the widget you enjoy using over and over and tell them how much you appreciate their effort. Email your MVP lead(s) and thank them for all their hard work as well. A little kindness goes a long way. You never know how much reaching out could mean to that person at that moment.]]></summary></entry><entry><title type="html">Pro SQL Server 2022 Wait Statistics Book</title><link href="https://sqlrockstar.github.io/2022/10/pro-sql-server-2022-wait-statistics-book/" rel="alternate" type="text/html" title="Pro SQL Server 2022 Wait Statistics Book" /><published>2022-10-10T11:26:54-04:00</published><updated>2022-10-10T11:26:54-04:00</updated><id>https://sqlrockstar.github.io/2022/10/pro-sql-server-2022-wait-statistics-book</id><content type="html" xml:base="https://sqlrockstar.github.io/2022/10/pro-sql-server-2022-wait-statistics-book/"><![CDATA[<p>After many months of editing, revising, and writing, my new book <em>Pro SQL Server 2022 Wait Statistics: A Practical Guide to Analyzing Performance in SQL Server and Azure SQL Database</em> is ready for print!</p>
<figure class="wp-block-image aligncenter size-full"><a href="https://amzn.to/3fQr7hz" target="_blank" rel="noreferrer noopener"><img src="https://thomaslarock.com/wp-content/uploads/2022/10/pro_sql_server_2022_wait_statictics.jpg" alt="Pro SQL Server 2022 Wait Statistics" class="wp-image-24909" /></a></figure>
<p>You can pre-order here: <a href="https://amzn.to/3fQr7hz" target="_blank" rel="noreferrer noopener">https://amzn.to/3fQr7hz</a></p>
<p>I thoroughly enjoyed this project, and I want to thank Apress and Jonathan Gennick for giving me the opportunity to update the previous edition. It felt good to be writing again, something I have not been doing enough of lately. And many thanks to Enrico van de Laar (<a href="https://twitter.com/evdlaar" target="_blank" rel="noreferrer noopener">@evdlaar</a>) for giving me amazing content to start with.</p>
<p>The book is an effort to help explain how, why, and when wait events happen. Of course, I also want to show how to solve issues when they arise. Specific wait events are broken down into parts: definition, remediation, and an example. There are plenty of code examples, allowing the reader to duplicate the scenarios to help understand the wait events better. </p>
<p>It is my understanding we will have a GitHub repository for the sample code. This will make it easy for a reader to access the code for their use. I am hoping to keep the repo up to date and expand upon the example as I look towards the next version.</p>
<h2 id="h-pro-sql-server-2022-wait-statistics-at-live-360"><em>Pro SQL Server 2022 Wait Statistics</em> at Live 360!</h2>
<p>I will be presenting material from the book at <a href="https://live360events.com/events/orlando-2022/Home.aspx" target="_blank" rel="noreferrer noopener">SQL Server Live!</a> this November where I have the following sessions, panel discussion, and workshop:</p>
<ul><li>Fast Focus: SQL Server Data Types and Performance</li><li>Locking, Blocking, and Deadlocks</li><li>Performance Tuning SQL Server using Wait Statistics</li><li>SQL Server Live! Panel Discussion: Azure Cloud Migration Discussion</li><li>Workshop: Introduction to Azure Data Platform for Data Professionals</li></ul>
<p>The workshop is a full day training session delivered with Karen Lopez (<a href="https://twitter.com/datachick" target="_blank" rel="noreferrer noopener">@DataChick</a>), and you can register for Live 360 here: <a href="https://na.eventscloud.com/ereg/index.php?eventid=666070" target="_blank" rel="noreferrer noopener">Live 360 Orlando 2022 - Choose Registration</a></p>
<p>I am hopeful to have copies of <em>Pro SQL Server 2022 Wait Statistics</em> at SQL Server Live!. At the time of this post, I do not know of a publish date. Amazon shows the book as pre-order <a href="https://amzn.to/3fQr7hz" target="_blank" rel="noreferrer noopener">right now</a>.</p>]]></content><author><name></name></author><category term="Azure" /><category term="SQL Server 2022" /><category term="SQL Server Performance" /><summary type="html"><![CDATA[After many months of editing, revising, and writing, my new book Pro SQL Server 2022 Wait Statistics: A Practical Guide to Analyzing Performance in SQL Server and Azure SQL Database is ready for print! You can pre-order here: https://amzn.to/3fQr7hz I thoroughly enjoyed this project, and I want to thank Apress and Jonathan Gennick for giving me the opportunity to update the previous edition. It felt good to be writing again, something I have not been doing enough of lately. And many thanks to Enrico van de Laar (@evdlaar) for giving me amazing content to start with. The book is an effort to help explain how, why, and when wait events happen. Of course, I also want to show how to solve issues when they arise. Specific wait events are broken down into parts: definition, remediation, and an example. There are plenty of code examples, allowing the reader to duplicate the scenarios to help understand the wait events better. It is my understanding we will have a GitHub repository for the sample code. This will make it easy for a reader to access the code for their use. I am hoping to keep the repo up to date and expand upon the example as I look towards the next version. Pro SQL Server 2022 Wait Statistics at Live 360! I will be presenting material from the book at SQL Server Live! this November where I have the following sessions, panel discussion, and workshop: Fast Focus: SQL Server Data Types and PerformanceLocking, Blocking, and DeadlocksPerformance Tuning SQL Server using Wait StatisticsSQL Server Live! Panel Discussion: Azure Cloud Migration DiscussionWorkshop: Introduction to Azure Data Platform for Data Professionals The workshop is a full day training session delivered with Karen Lopez (@DataChick), and you can register for Live 360 here: Live 360 Orlando 2022 - Choose Registration I am hopeful to have copies of Pro SQL Server 2022 Wait Statistics at SQL Server Live!. At the time of this post, I do not know of a publish date. Amazon shows the book as pre-order right now.]]></summary></entry><entry><title type="html">Stop Using Production Data For Development</title><link href="https://sqlrockstar.github.io/2022/01/stop-using-production-refresh-development/" rel="alternate" type="text/html" title="Stop Using Production Data For Development" /><published>2022-01-31T09:33:43-05:00</published><updated>2022-01-31T09:33:43-05:00</updated><id>https://sqlrockstar.github.io/2022/01/stop-using-production-refresh-development</id><content type="html" xml:base="https://sqlrockstar.github.io/2022/01/stop-using-production-refresh-development/"><![CDATA[<p>A common software development practice is to take data from a production system and restore it to a different environment, often called "test", "development", "staging", or even "QA". This allows for support teams to troubleshoot issues without making changes to the true production environment. It also allows for development teams to build new versions and features of existing products in a non-production environment. Using production to refresh development is just one of those things everyone accepts and does, without question.</p>
<p>Of course the idea of testing in a non-production environment isn't anything new. Consider Haggis. No way someone thought to themselves "let me just shove everything I can into this sheep's stomach, boil it, and serve it for dinner tonight." You know they first fed it to the neighbor nobody liked. Probably right after they shoved a carton of milk in their face and asked "does this smell bad to you?"</p>
<p>For decades software development has made it a standard practice to create copies of production data and restore it to other non-production environments. It was not without issues, however. For example, as data sizes grew so did the length of time to do a restore. This also clogged network bandwidth, not to mention the costs associated with storage. </p>
<p>And then there is this:</p>
<figure class="wp-block-embed is-type-rich is-provider-twitter wp-block-embed-twitter"><div class="wp-block-embed__wrapper"> https://twitter.com/HengeWitch/status/1483500385180418048 </div></figure>
<p>If you read that tweet and thought "yeah, what's your point?" then you are part of the problem. </p>
<p>As an industry we focus on access to specific environments, but not the assets in the environments. This is wrong. The royal family knows where the Crown Jewels are stored but if they are moved to another location you know the Jewels are heavily guarded at all times. <strong>Access to the jewels is important no matter where the jewels are located</strong>. The same should be true of your production data.</p>
<div class="wp-block-image"><figure class="aligncenter"><img src="https://upload.wikimedia.org/wikipedia/commons/e/eb/Crown_jewels_Poland_8.JPG" alt="Use production to refresh development." /><figcaption><em>Then again, that stick might be pointy enough to fend off any attacker.</em></figcaption></figure></div>
<p>Data is the most critical asset your company owns. <strong>If you make efforts to lock down production but allow production data to flow to less-secure environments, then you haven't locked down production</strong>.</p>
<p>It is ludicrous to think about the billions of dollars spent to lock down physical access to data centers only to allow junior developers to stuff customer data on a laptop they will then leave behind on a bus. Or senior developers leaving S3 buckets open. Or forgetting they pushed credentials to a GitHub repo. </p>
<p>If you are still moving production data between environments you are a data breach waiting to happen. I don't care what the auditors say, you are at an elevated and unnecessary risk. Like when Obi-Wan decides to protect baby Luke by keeping his name and taking him to Darth Vader's home planet. Nice job, Ben, no way this ends up with you dying, naked, in front a few dozen onlookers. </p>
<p>I think what frustrates me most is this entire system is unnecessary. You have options when moving production data. You can use data masking, obfuscation, and encryption in order to reduce your risk. But the best method is to <strong>not move your data at all</strong>.</p>
<p>After years of being told "don't test in production" it's time to think about testing in production. <a href="https://www.infoworld.com/article/3271126/what-is-cicd-continuous-integration-and-continuous-delivery-explained.html" target="_blank" rel="noreferrer noopener">Continuous integration and continuous delivery/deployment</a> (CI/CD) allow for you to achieve this miracle. And for those that say "No, you dummy, CI/CD is what you do in test <strong>before</strong> you push to production," I offer the following.</p>
<p>Use dummy data.</p>
<p>You don't need production data, you need data that <strong>looks</strong> like production data. You don't need actual customer names and address, you need similar names and address. And there are ways to <a href="https://thomaslarock.com/2015/07/how-to-recreate-sql-server-statistics-in-a-different-environment/" target="_blank" rel="noreferrer noopener">simulate the statistics in your database</a>, too, so your query plans have the same shape as production without the actual volume of data.</p>
<p>It's possible for you to develop software code against simulated production data, as opposed to actual production data. But doing so requires more work, and nobody likes more work.</p>
<p>Until you are breached, of course. Then the extra work won't be optional. </p>]]></content><author><name></name></author><category term="Data Security and Privacy" /><category term="SQL MVP" /><summary type="html"><![CDATA[A common software development practice is to take data from a production system and restore it to a different environment, often called "test", "development", "staging", or even "QA". This allows for support teams to troubleshoot issues without making changes to the true production environment. It also allows for development teams to build new versions and features of existing products in a non-production environment. Using production to refresh development is just one of those things everyone accepts and does, without question. Of course the idea of testing in a non-production environment isn't anything new. Consider Haggis. No way someone thought to themselves "let me just shove everything I can into this sheep's stomach, boil it, and serve it for dinner tonight." You know they first fed it to the neighbor nobody liked. Probably right after they shoved a carton of milk in their face and asked "does this smell bad to you?" For decades software development has made it a standard practice to create copies of production data and restore it to other non-production environments. It was not without issues, however. For example, as data sizes grew so did the length of time to do a restore. This also clogged network bandwidth, not to mention the costs associated with storage. And then there is this: https://twitter.com/HengeWitch/status/1483500385180418048 If you read that tweet and thought "yeah, what's your point?" then you are part of the problem. As an industry we focus on access to specific environments, but not the assets in the environments. This is wrong. The royal family knows where the Crown Jewels are stored but if they are moved to another location you know the Jewels are heavily guarded at all times. Access to the jewels is important no matter where the jewels are located. The same should be true of your production data. Then again, that stick might be pointy enough to fend off any attacker. Data is the most critical asset your company owns. If you make efforts to lock down production but allow production data to flow to less-secure environments, then you haven't locked down production. It is ludicrous to think about the billions of dollars spent to lock down physical access to data centers only to allow junior developers to stuff customer data on a laptop they will then leave behind on a bus. Or senior developers leaving S3 buckets open. Or forgetting they pushed credentials to a GitHub repo. If you are still moving production data between environments you are a data breach waiting to happen. I don't care what the auditors say, you are at an elevated and unnecessary risk. Like when Obi-Wan decides to protect baby Luke by keeping his name and taking him to Darth Vader's home planet. Nice job, Ben, no way this ends up with you dying, naked, in front a few dozen onlookers. I think what frustrates me most is this entire system is unnecessary. You have options when moving production data. You can use data masking, obfuscation, and encryption in order to reduce your risk. But the best method is to not move your data at all. After years of being told "don't test in production" it's time to think about testing in production. Continuous integration and continuous delivery/deployment (CI/CD) allow for you to achieve this miracle. And for those that say "No, you dummy, CI/CD is what you do in test before you push to production," I offer the following. Use dummy data. You don't need production data, you need data that looks like production data. You don't need actual customer names and address, you need similar names and address. And there are ways to simulate the statistics in your database, too, so your query plans have the same shape as production without the actual volume of data. It's possible for you to develop software code against simulated production data, as opposed to actual production data. But doing so requires more work, and nobody likes more work. Until you are breached, of course. Then the extra work won't be optional.]]></summary></entry><entry><title type="html">Microsoft Data Platform MVP – A Baker’s Dozen</title><link href="https://sqlrockstar.github.io/2021/07/microsoft-data-platform-mvp-a-bakers-dozen/" rel="alternate" type="text/html" title="Microsoft Data Platform MVP – A Baker’s Dozen" /><published>2021-07-29T07:28:28-04:00</published><updated>2021-07-29T07:28:28-04:00</updated><id>https://sqlrockstar.github.io/2021/07/microsoft-data-platform-mvp-a-bakers-dozen</id><content type="html" xml:base="https://sqlrockstar.github.io/2021/07/microsoft-data-platform-mvp-a-bakers-dozen/"><![CDATA[<div class="wp-block-image is-style-default"><figure class="aligncenter size-full"><img src="https://thomaslarock.com/wp-content/uploads/2021/07/MVP2021.jpg" alt="" class="wp-image-21239" /><figcaption>No Satya, thank you. And you're welcome. Let's do lunch next time I'm in town.</figcaption></figure></div>
<p></p>
<p>This past week I received another care package from Satya Nadella. Inside was my Microsoft Data Platform MVP award for 2021-2022. I am happy, honored, and humbled to receive the Microsoft Data Platform MVP award for the thirteenth straight year. I still recall my first MVP award and how it got&nbsp;<a href="https://thomaslarock.com/2009/04/latest-email-scam/" target="_blank" rel="noreferrer noopener">caught in the company spam folder</a>. Good times.</p>
<p>I am not able to explain&nbsp;<a href="https://mvp.microsoft.com/en-us/overview" target="_blank" rel="noreferrer noopener">why I am considered an MVP</a>&nbsp;and others are not. I have no idea what it takes to be an MVP. And neither does anyone else.&nbsp;Well, maybe Microsoft does since they are the ones that bestow the award on others. But there doesn’t seem to be any magical formula to determine if someone is an MVP or not.</p>
<p>I do my best to help others.&nbsp;<a href="https://thomaslarock.com/2017/05/relationships-matter-money/" target="_blank" rel="noreferrer noopener">I value&nbsp;people and relationships over money</a>. And I play around with many Microsoft data tools and applications, and&nbsp;<a href="https://thomaslarock.com/blog" target="_blank" rel="noreferrer noopener">blog</a>&nbsp;about the things I find interesting. Sometimes those blog posts are close to&nbsp;<a href="http://www.urbandictionary.com/define.php?term=fanboi" target="_blank" rel="noreferrer noopener">fanboi</a>&nbsp;level, other times they are not. But I do my best to remember that there are people over in Redmond that work hard on delivering quality. Sometimes they miss, and I do my best to help them stay on target. Maybe that’s why they keep me around.</p>
<p>Looking back to 2009 and my first award, I recognize the activities I was doing 13 years ago which earned my my first MVP award are not the same activities I am doing today. And I think that is to be expected, as I'm not the same person today as I was then. I have a different role, different responsibilities, and different priorities. I've branched out into the world of data security and privacy as well as data science.</p>
<p>I now spend time writing for multiple online publications instead of my here on my personal blog. Often those articles are not about SQL Server, but are almost always about data. I remain an advocate for Microsoft technologies, and continue to do my best to influence others to see the value in the products and services coming out of Redmond.</p>
<p>This past year was a bit different, of course, as COVID affected different parts of the world in different ways, at different times. As such, the Microsoft MVP program made the decision to auto renew MVPs without evaluating our current activity. This year's award is the equivalent of Free Parking in Monopoly, Sure, you're still in the game, but you aren't doing much, things are happening around you, and everything is OK. </p>
<h2 id="h-summary">Summary</h2>
<p>I’m going to enjoy this ride while it lasts. I’m also going to do my part to make certain that the ride lasts as long as possible for everyone. Here’s a #ProTip for those of us renewed this year:</p>
<p><strong>Say thank you. Then say it again</strong>. Be grateful for what we have. Email the person that made the widget that you enjoy using over and over and tell them how much you appreciate their effort. Email your MVP lead and thank them for all their hard work as well.</p>
<p>MVPs do advocate for Microsoft because we want to, not because we want an award. After all these years I’m still crazy for Microsoft, and I am happy to help promote the best data platform on the planet.</p>]]></content><author><name></name></author><category term="Azure" /><category term="SQL MVP" /><category term="Microsoft MVP" /><summary type="html"><![CDATA[No Satya, thank you. And you're welcome. Let's do lunch next time I'm in town. This past week I received another care package from Satya Nadella. Inside was my Microsoft Data Platform MVP award for 2021-2022. I am happy, honored, and humbled to receive the Microsoft Data Platform MVP award for the thirteenth straight year. I still recall my first MVP award and how it got&nbsp;caught in the company spam folder. Good times. I am not able to explain&nbsp;why I am considered an MVP&nbsp;and others are not. I have no idea what it takes to be an MVP. And neither does anyone else.&nbsp;Well, maybe Microsoft does since they are the ones that bestow the award on others. But there doesn’t seem to be any magical formula to determine if someone is an MVP or not. I do my best to help others.&nbsp;I value&nbsp;people and relationships over money. And I play around with many Microsoft data tools and applications, and&nbsp;blog&nbsp;about the things I find interesting. Sometimes those blog posts are close to&nbsp;fanboi&nbsp;level, other times they are not. But I do my best to remember that there are people over in Redmond that work hard on delivering quality. Sometimes they miss, and I do my best to help them stay on target. Maybe that’s why they keep me around. Looking back to 2009 and my first award, I recognize the activities I was doing 13 years ago which earned my my first MVP award are not the same activities I am doing today. And I think that is to be expected, as I'm not the same person today as I was then. I have a different role, different responsibilities, and different priorities. I've branched out into the world of data security and privacy as well as data science. I now spend time writing for multiple online publications instead of my here on my personal blog. Often those articles are not about SQL Server, but are almost always about data. I remain an advocate for Microsoft technologies, and continue to do my best to influence others to see the value in the products and services coming out of Redmond. This past year was a bit different, of course, as COVID affected different parts of the world in different ways, at different times. As such, the Microsoft MVP program made the decision to auto renew MVPs without evaluating our current activity. This year's award is the equivalent of Free Parking in Monopoly, Sure, you're still in the game, but you aren't doing much, things are happening around you, and everything is OK. Summary I’m going to enjoy this ride while it lasts. I’m also going to do my part to make certain that the ride lasts as long as possible for everyone. Here’s a #ProTip for those of us renewed this year: Say thank you. Then say it again. Be grateful for what we have. Email the person that made the widget that you enjoy using over and over and tell them how much you appreciate their effort. Email your MVP lead and thank them for all their hard work as well. MVPs do advocate for Microsoft because we want to, not because we want an award. After all these years I’m still crazy for Microsoft, and I am happy to help promote the best data platform on the planet.]]></summary></entry></feed>