SQL Server performance objects are found inside the Performance Monitor tool, also known as perfmon. If you are using Performance Monitor for gathering resource metrics for SQL Server then you are familiar with a screen such as this one:
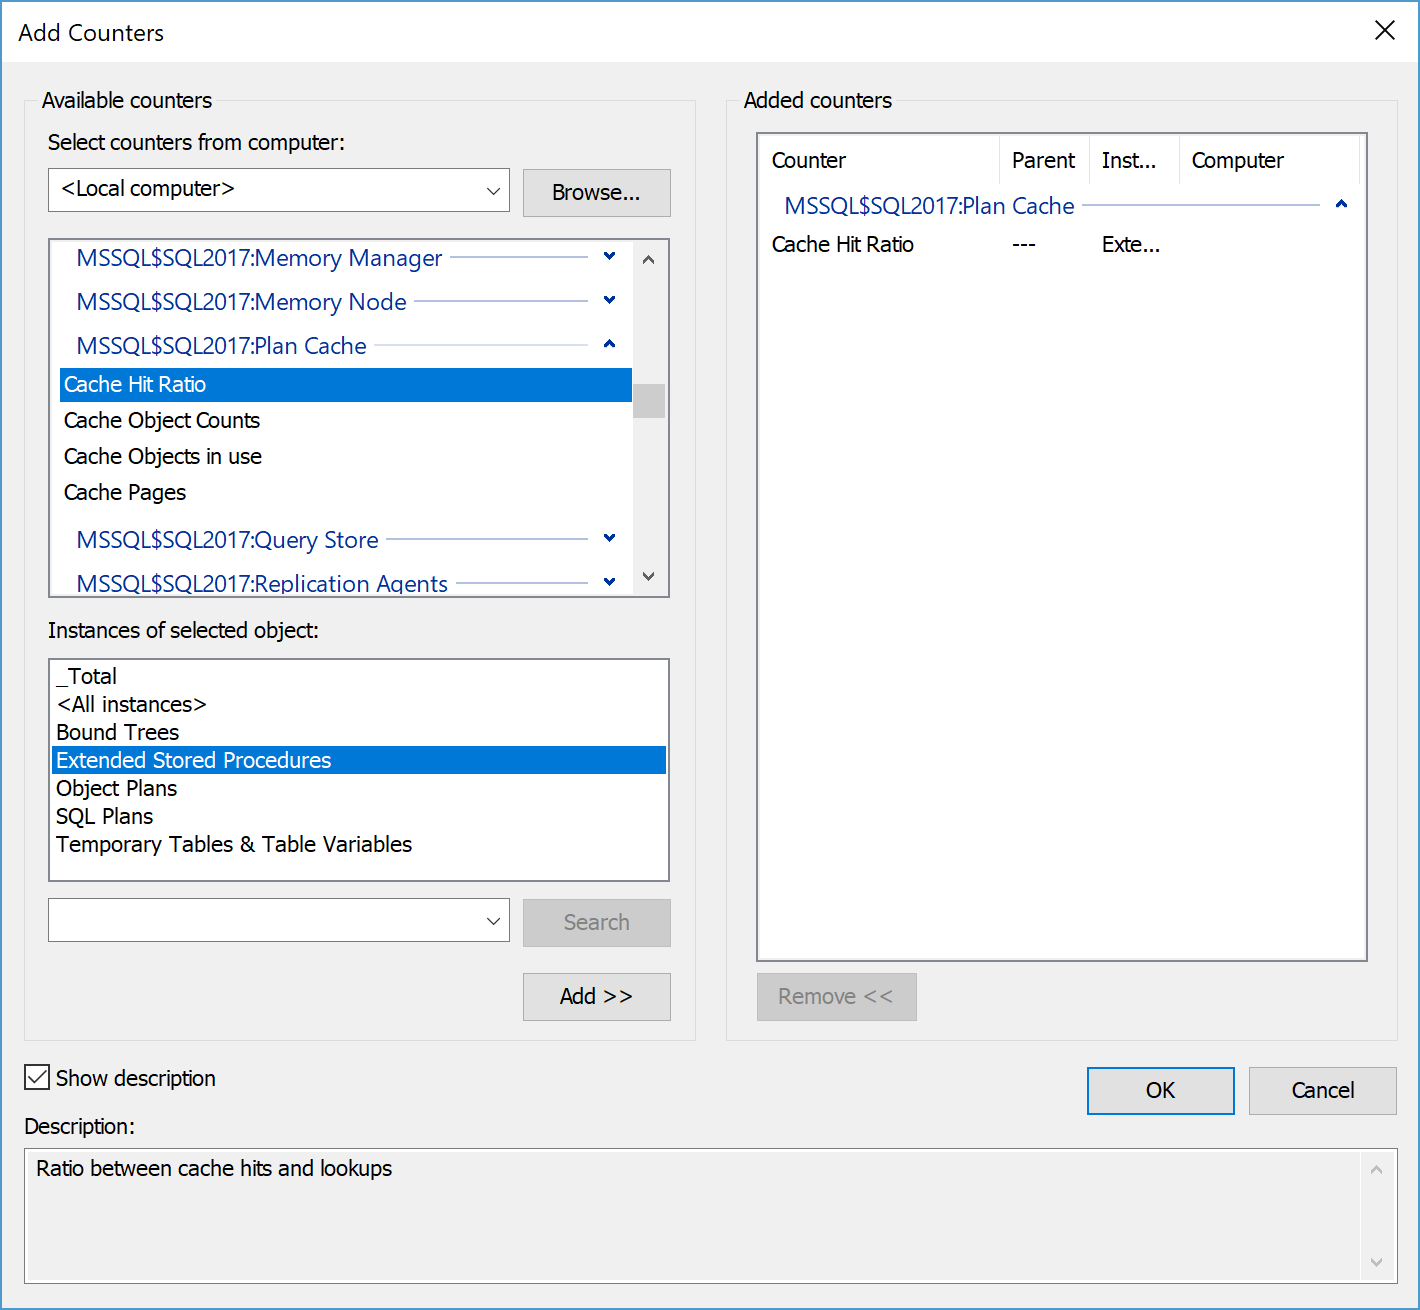
You can see I have navigated to the SQL Server Plan Cache counter, selected Cache Hit Ratio, and an instance of Extended Stored Procedures. You will also note in the lower left I have enabled “Show description”. This results in the text at the bottom, “Ratio between cache hits and lookups”.
That text is referring to the counter itself, and not to the instance. If I toggle to another instance, such as SQL plans, the text doesn’t change. I have an idea what SQL plans means, but I’m also smart enough to know I don’t know everything. So, where would one find information about the instances?
Those details can be found here: Use SQL Server Objects. From there we can go to the SQL Server, Plan Cache Object page, where we will find the following details:
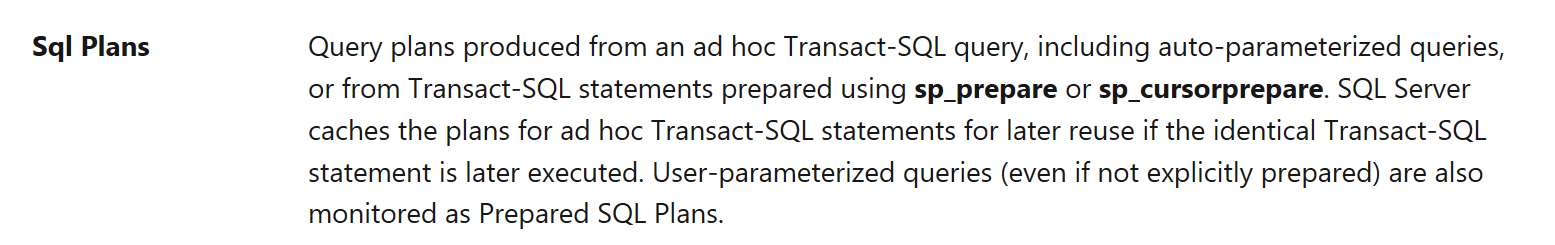
That’s a lot more detail than I was expecting! Now I know exactly what this counter will consider to be a plan. These details provide more context to the metric, helping users understand what they are measuring.
Having SQL Server performance objects documented is important, and you should review them. Otherwise you run a risk of collecting the wrong metrics.