As you may have heard, last week I finished the capstone project for the data science course offered through Microsoft Academy. I learned a lot of things while taking the course. Some of these things are probably not new to you. For example, I didn’t know you could select a bunch of rows and columns in Excel this quickly:
Sure, that’s old news for many of you. But I don’t work in Excel enough to have the need to know such shortcuts. And when you start working with thousands of rows and hundreds of columns, tricks like that become useful.
Here’s another trick I learned: Excel has a Data Analysis pack available as an Excel add-in.
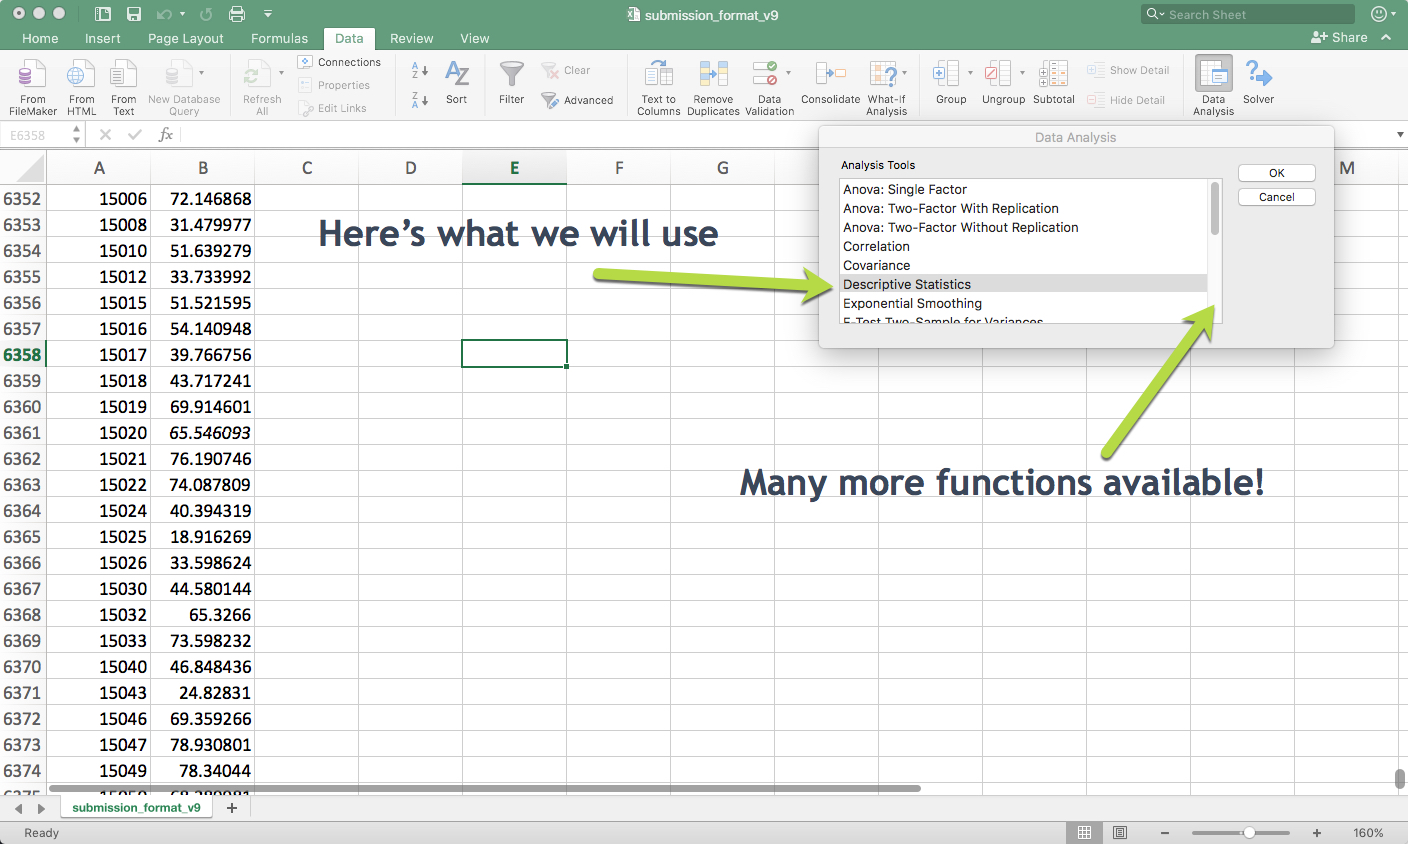
The Data Analysis toolpack has a lot of useful statistical functions. The first one I used in the course was the descriptive statistics. All we need to do is point it at some data:
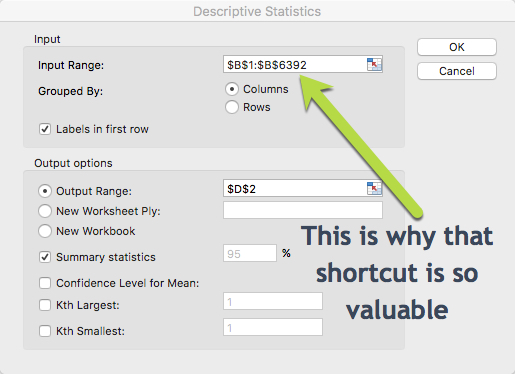
Click OK and observed the statistical goodness:
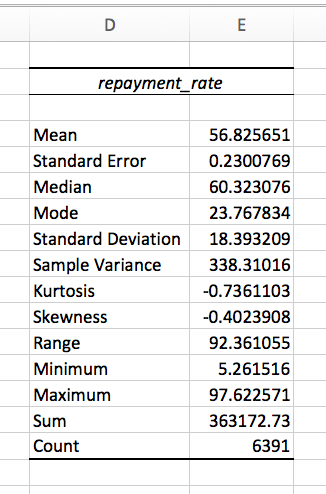
Here I was, calculating these numbers the old-fashioned way. Now I know how to get the same results in far less time.
What’s more, this underscores why Excel is the go-to tool for millions of business pros each day. If I wanted to get these same results inside of SQL Server, I would need to write T-SQL to get the job done. It wouldn’t be hard for me to do that, but I’ve been writing database queries for some time now. For business pros, they don’t care to spend time writing T-SQL, they just want to use Excel to do some basic math and statistics. And I can’t blame them, either, since Excel also allows for things like this:
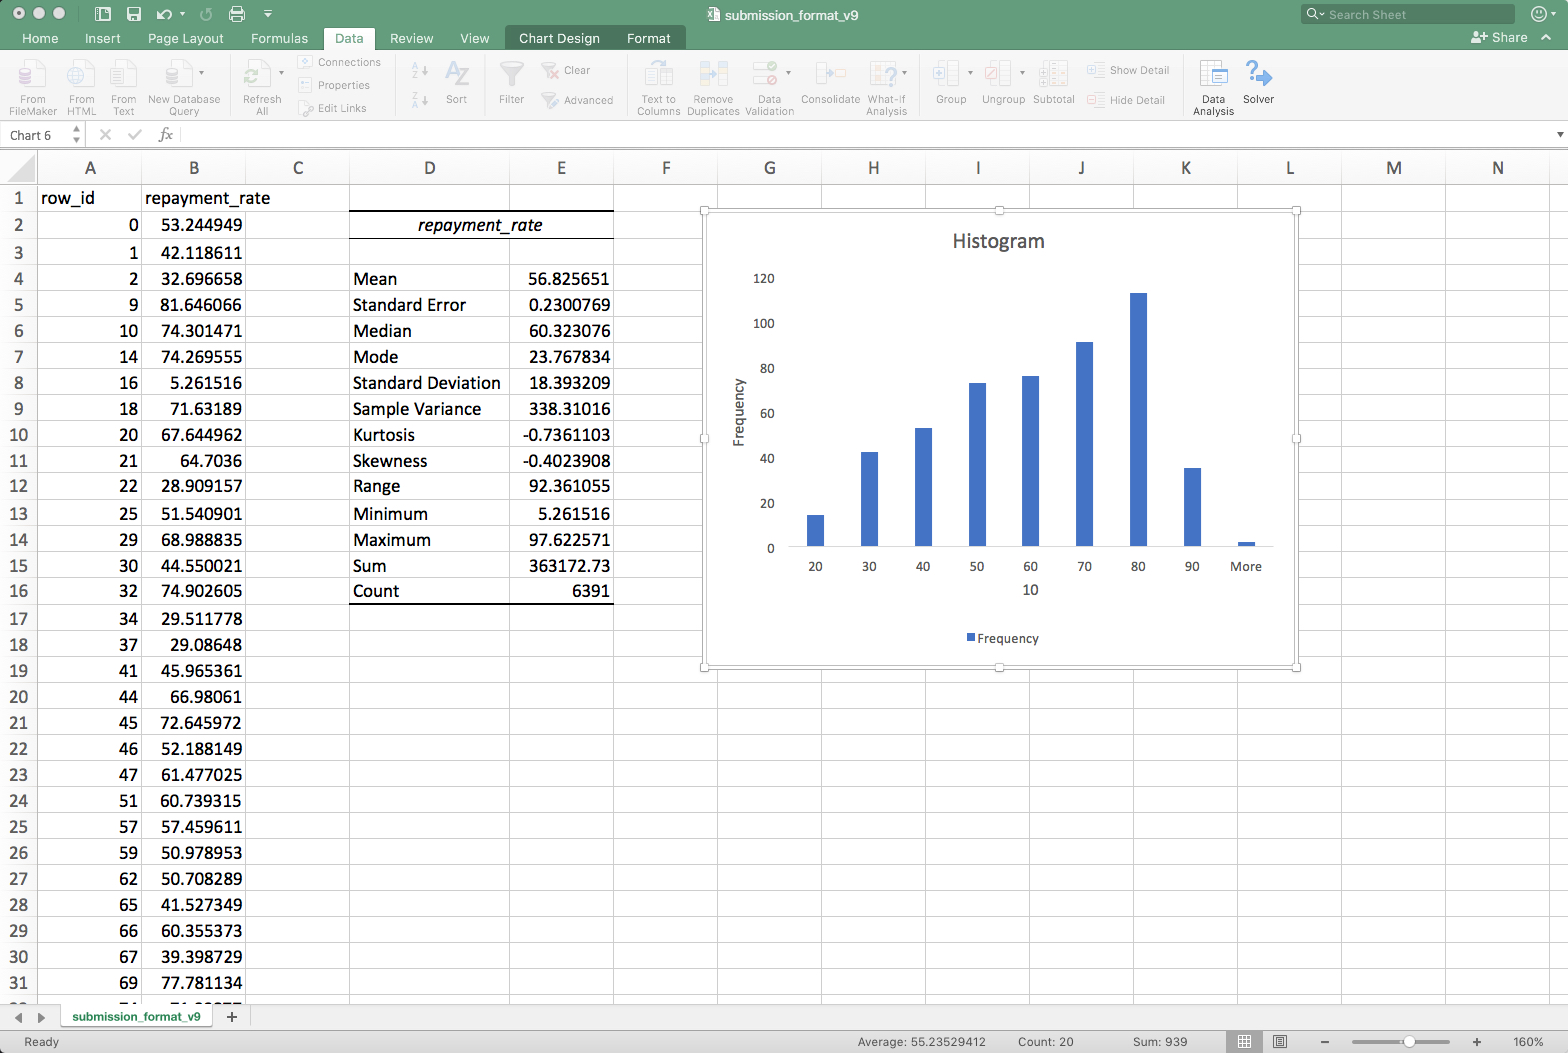
Yes, it’s a simple histogram. You know how to create simple histograms in SSMS using T-SQL? You don’t, that’s how. (OK, you can, but it’s not as easy as Excel).
There’s lots of little things like this I learned during the 10-course program. I didn’t keep a list, but wish I had. I will keep posting and sharing as I remember. Let’s just say that I the course was eye-opening for me in terms of what Excel and PowerBI can do for data professionals. It also helped me understand that the future for data professionals isn’t in query tuning, but in data analysis.
Awesome tips, great thanks for this (I use R for this types calculation but for business users its time saver number one). Could you post another excel tricks?
Thanks for the comment. I do have a few other tips I learned from the course. They aren’t all Excel tips though. If you want Excel focused stuff, head over to https://powerpivotpro.com/ and http://www.mrexcel.com/, they have everything you need.
Thomas, thanks for quick reply and links.
I loved the Data Analysis Toolpack, especially for the statistical tests (t-tests, z-tests …). And yes, in the last versions it’s really easy to create a histogram. Even easier than in Power BI.
Agreed, it does seem to be easier. I find myself going back and forth these days.